

They say a picture is worth a thousand words an din Apex designer you can visualize your data using a graph or chart. Presenting a chart is actually straightforward with a few basic steps. Let's walk through the process. You can get the data through a user interface method (see Reading And Saving Data In User Interface Methods) but here we are going to show you how to get the data by running a native SQL statement.
Create a Behavior
Open the Supplier business object and add a behavior named "purchaseOrdersBySupplier". Make it an Http Get Class Behavior returning any[]:
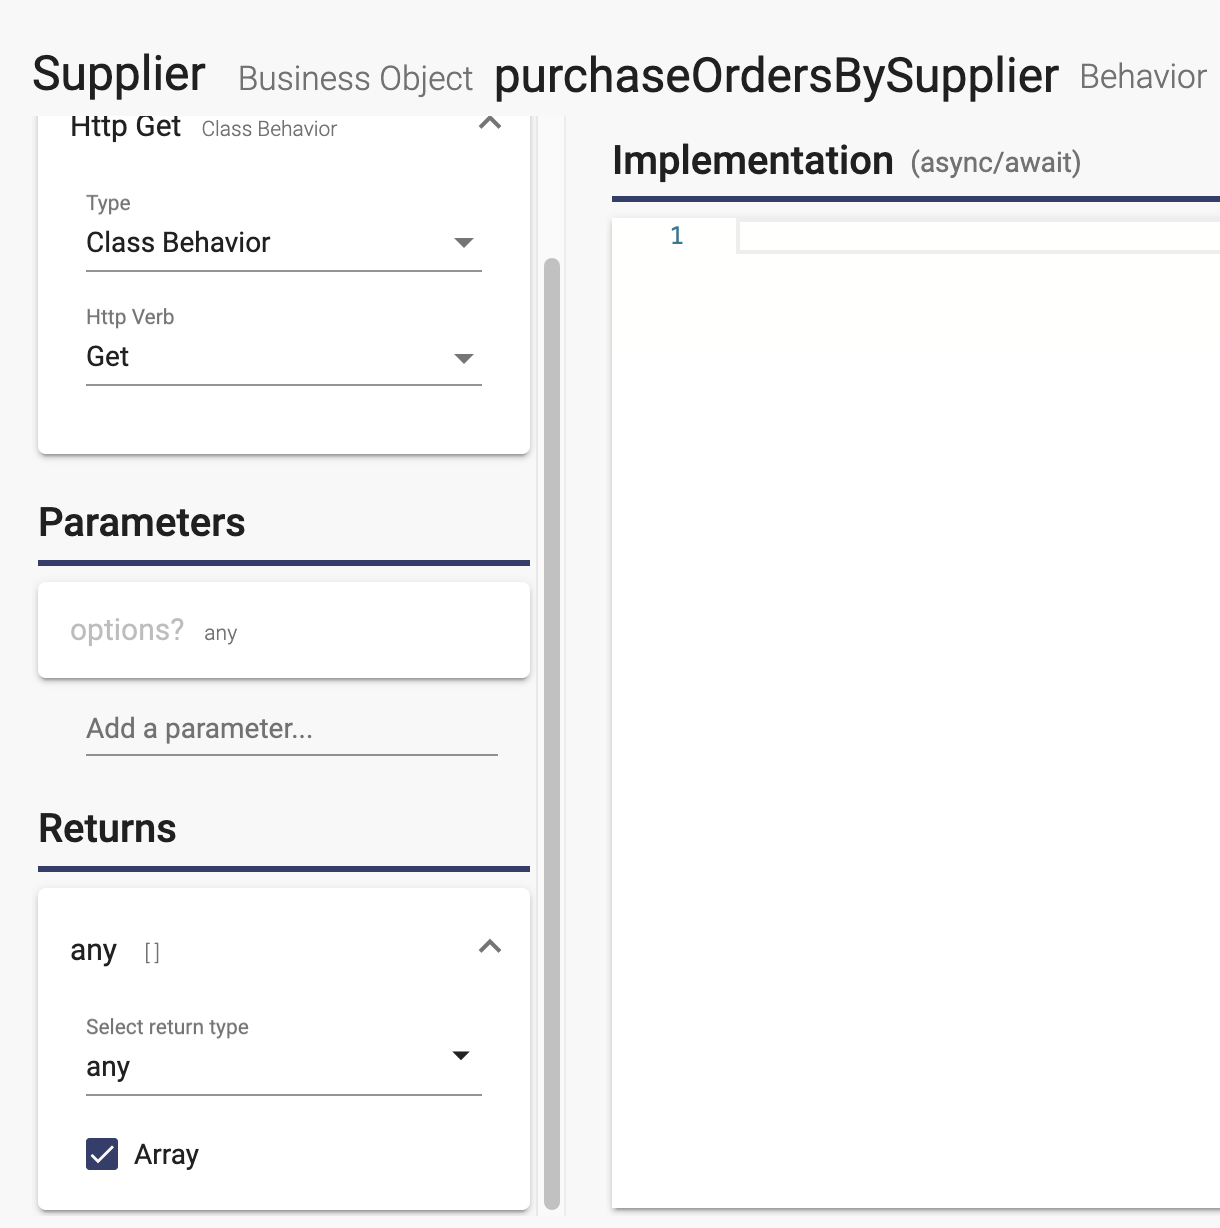
Add the following code to the behavior implementation:
let sql = `
select
  s.id,
  s.name,
  count(po.id) as "numberOfPurchaseOrders"
from Supplier s
left join PurchaseOrder po on po.supplierId = s.id
group by
  s.id,
  s.name
having
  count(po.id) > 0
order by
  s.name
`;
debug('sql', sql);

let results = await this.execute(sql, [], options);

return results;
Let's walk through this code.
In the sql, notice that
- the table names are the model names and the property names are the column names
- we used a back tick (`) on the first line and last line of the sql. In JavaScript, that lets us enter a string value that includes newline characters. This makes the SQL more readable.
- the column alias is in double quotes. This ensures that the properties in the result set are lower camel case (they would come through in all lowercase otherwise).
In the execute method, the SQL is the first input. The list of parameters is second (this query does not have any parameters). The third parameter are the options that are passed into this behavior.
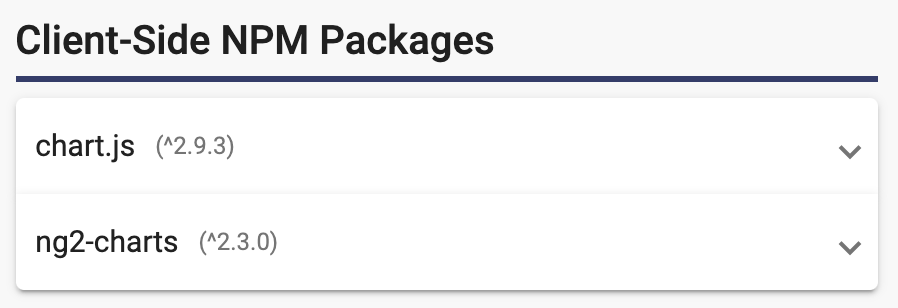
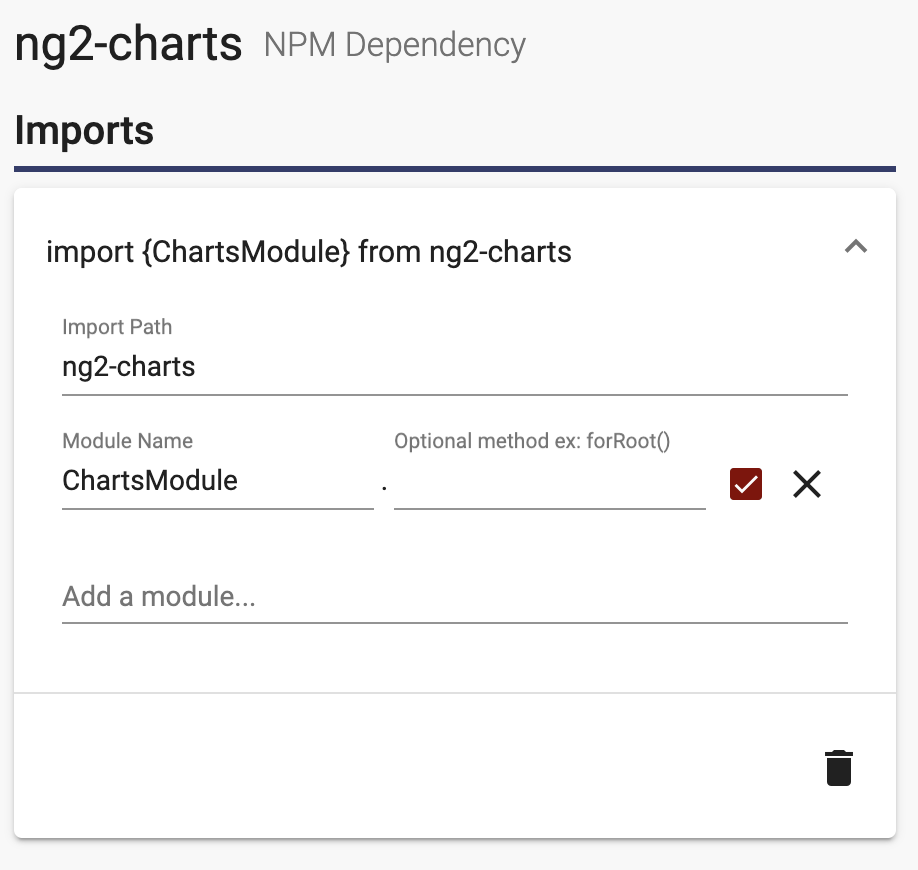
Add the Dependency
Add npm package ng2-charts as a client side dependency and import NgChartsModule as mentioned in the ng2-charts documentation (see Dependencies on how to add an NPM package). You will also need to include chart.js client dependency, as mentioned in the ng2-charts documentation.
Create User Interface
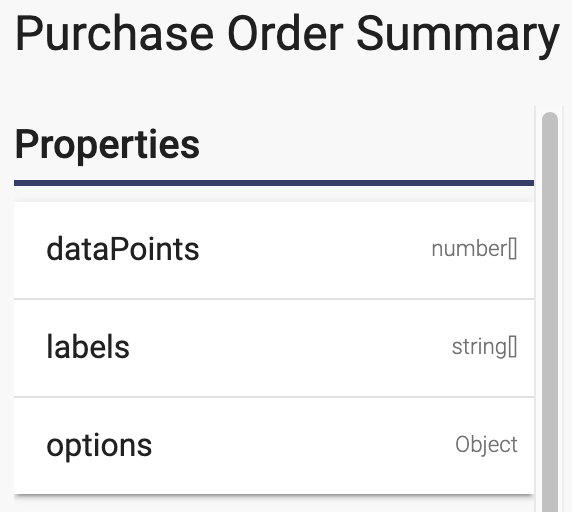
Create a user interface page Purchase Order Summary (see User Interfaces for page creation).
Properties
Add these properties to your user interface:
Methods
Add the following two methods to your user interface
- getData: It is run on load and does an http get using the url of the business object behavior you created above. It will process the results into a dataset for the chart, and the supplier names as the chart labels:

let url = '/api/Suppliers/purchaseOrdersBySupplier'; let results: any = await this.httpClient.get(url).toPromise(); debug('results', results); this.dataPoints = []; this.labels = []; for (let result of results) { this.labels.push(result.name); this.dataPoints.push(result.numberOfPurchaseOrders); } debug('this.dataPoints', this.dataPoints); debug('this.labels', this.labels); -
setOptions: It is run on load and sets options for the chart:

this.options = {
	responsive: true,
	maintainAspectRatio: false,
	scales: {
		yAxes: [
			{
				ticks: {
					beginAtZero: true
				}
			}
		]
	}
};
You can read more about the options in the ng2-charts NPM Package Documentation.
Template
Add a Canvas element inside a container Division. This is where the chart will be drawn.
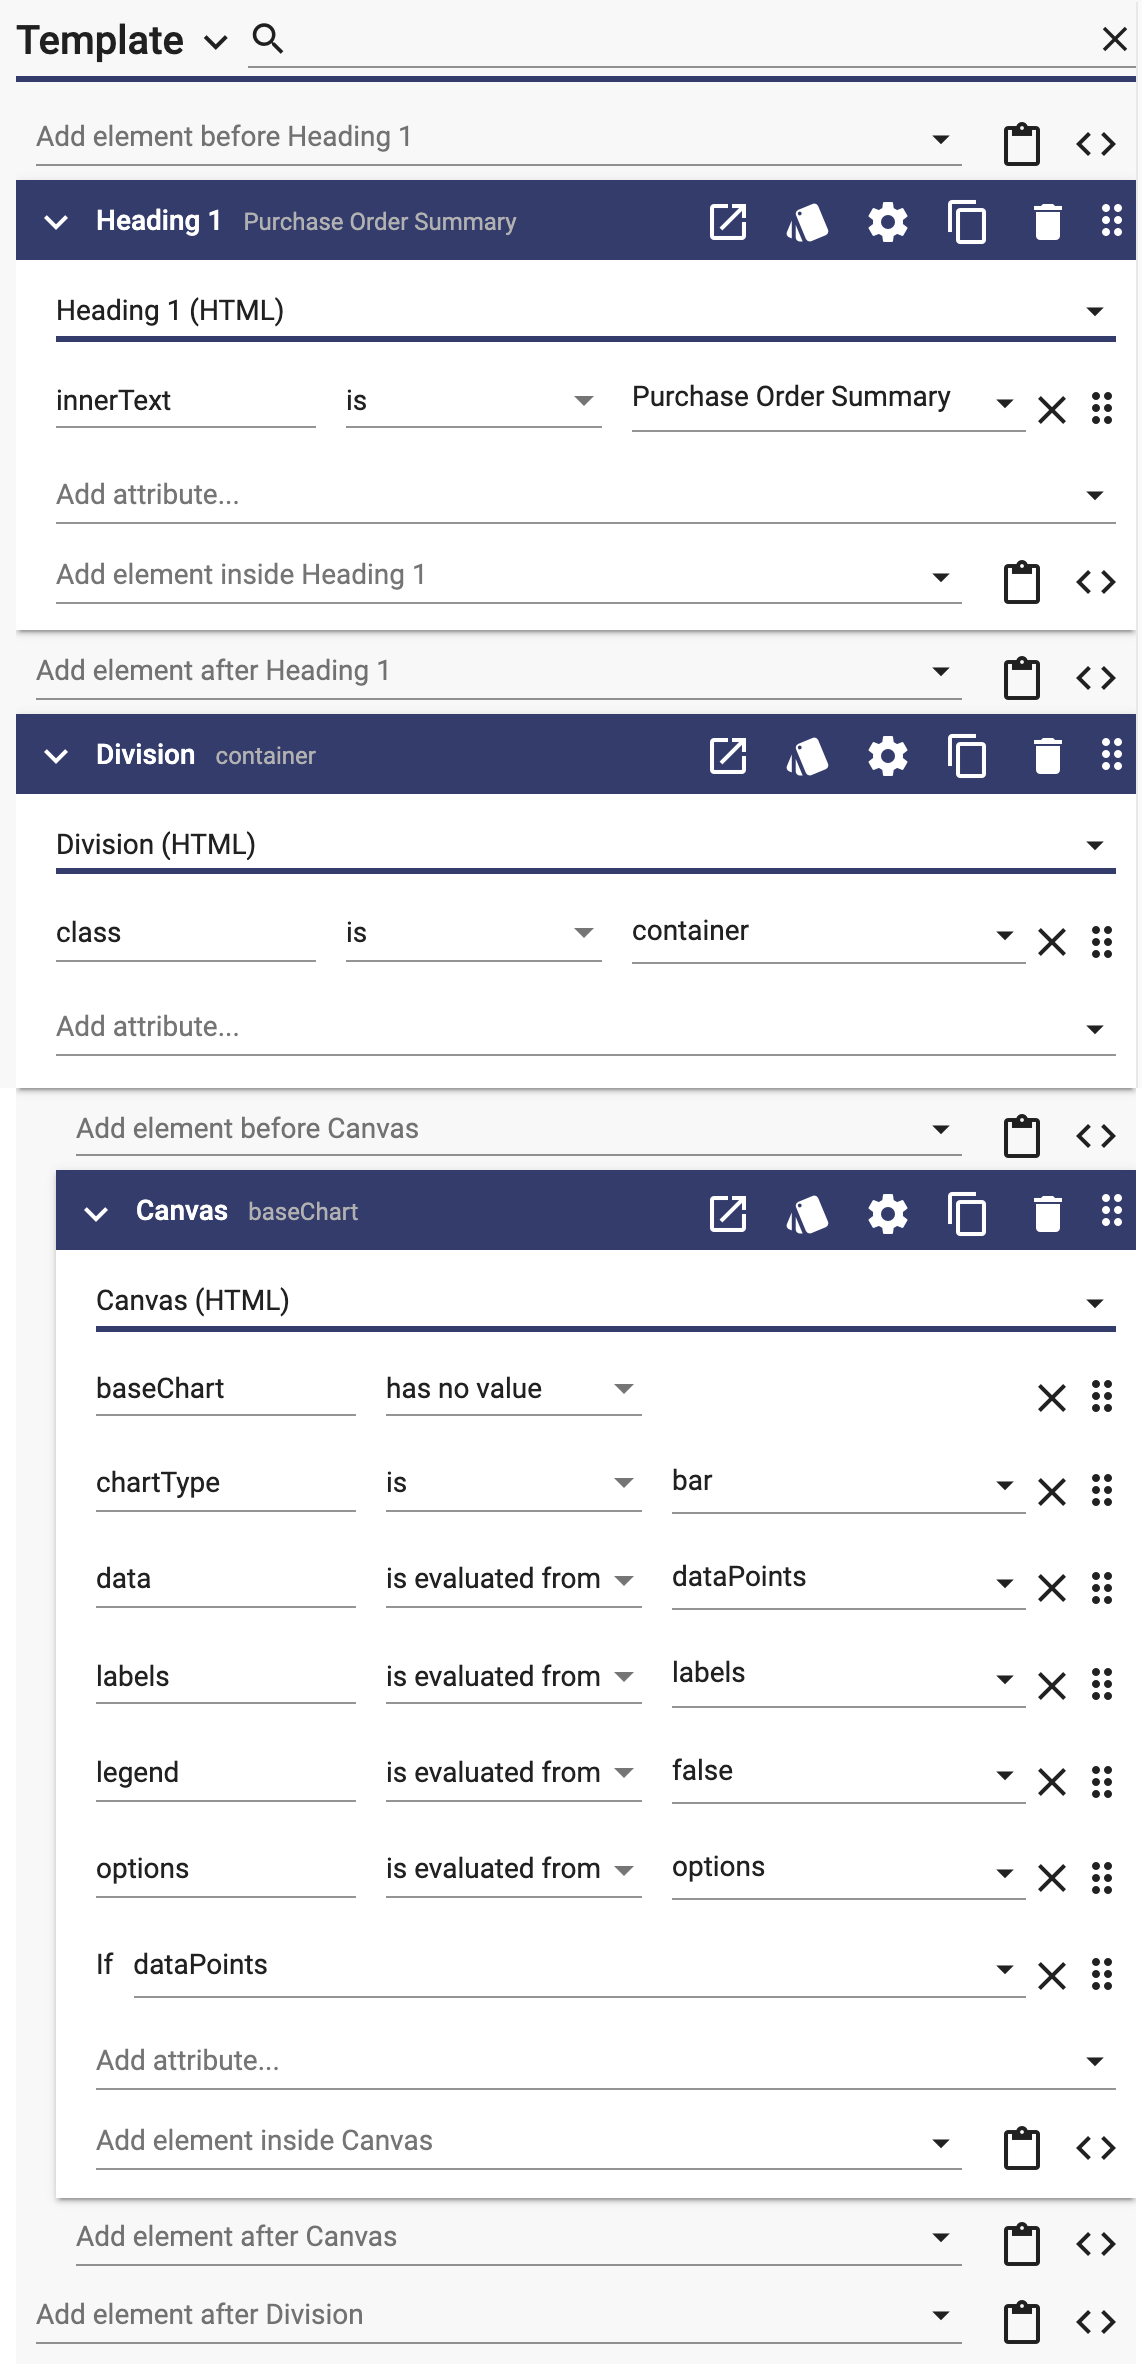
Style
You can set the size of your chart by adding a style to the Div containing the Canvas. We already assigned the container class to the Div containing canvas above. To do this open Styles by clicking and then add the following style:
div.container {
	height: 50vh;
	width: 50vw;
}
Result
Generate your project and go to /purchaseOrderSummary page to see your chart:
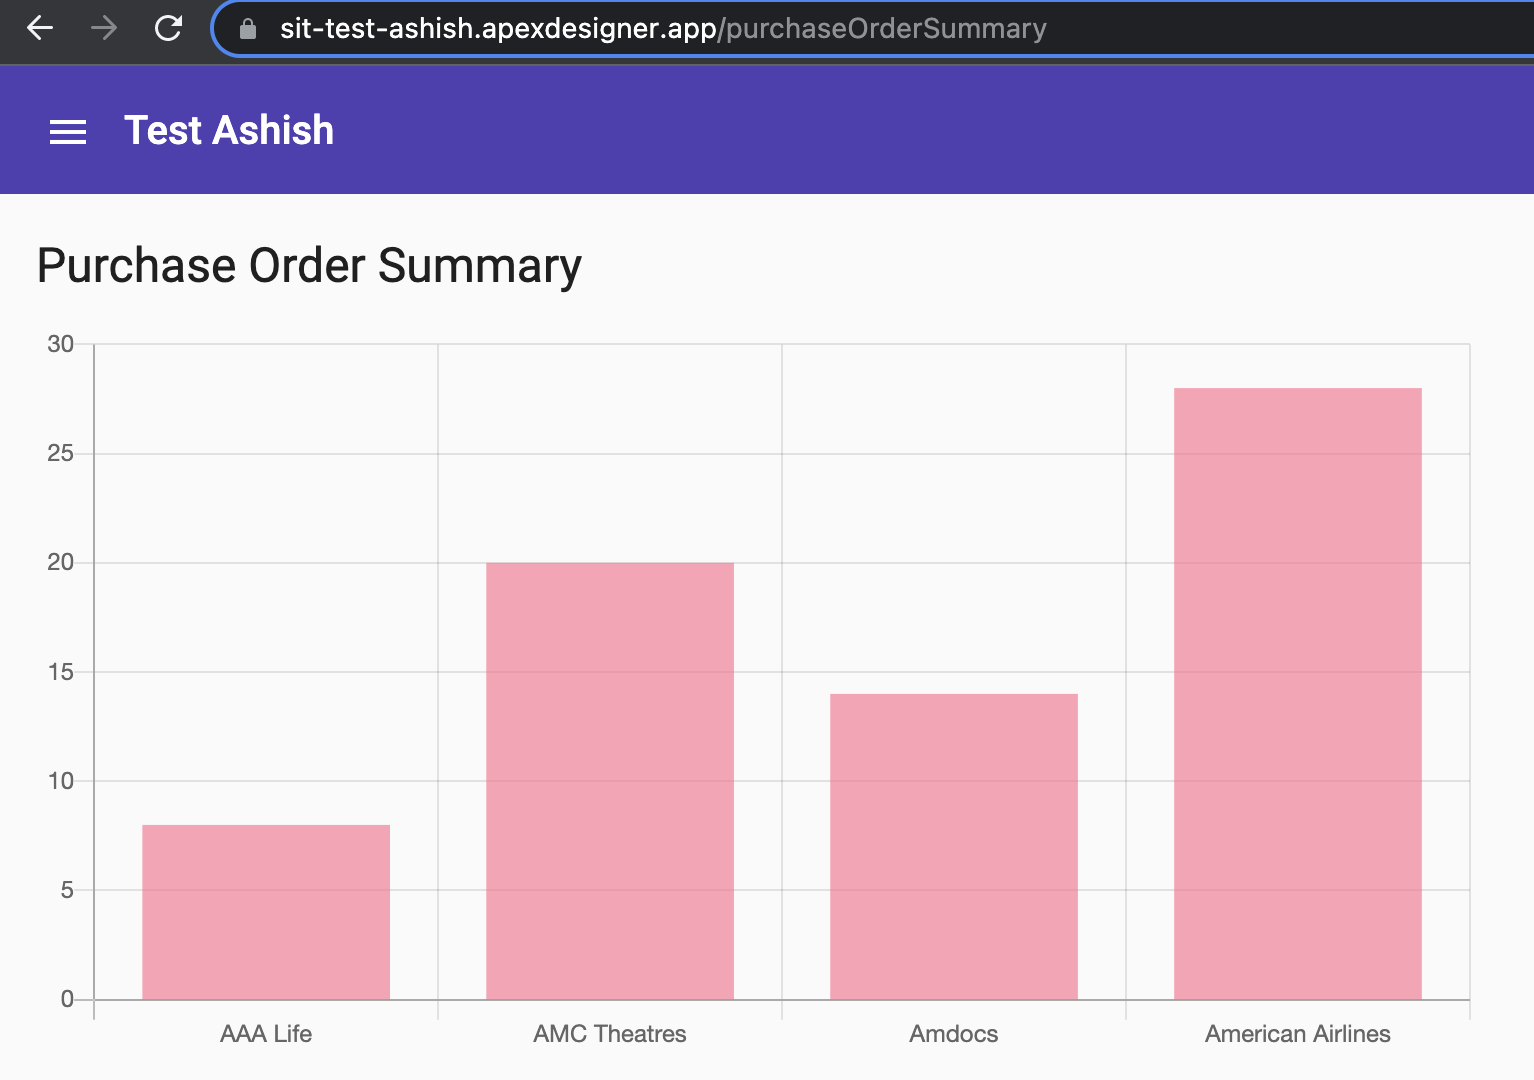
Now you can visualize your data instead of just reporting the numbers.