

Logging traces of what is happening in business logic is critical both during development and as a part of production support. Apex Designer makes it super easy to consistently add logging to your behavior logic.
Debug Module
There are lots of great npm modules out there but I have to say that debug is my favorite. With 150 million downloads a week, it looks like I'm not alone. The part I like most about the debug module is the concept of a hierarchy of debug strings and the ability to filter by those at runtime.
Adding Debug to Behaviors
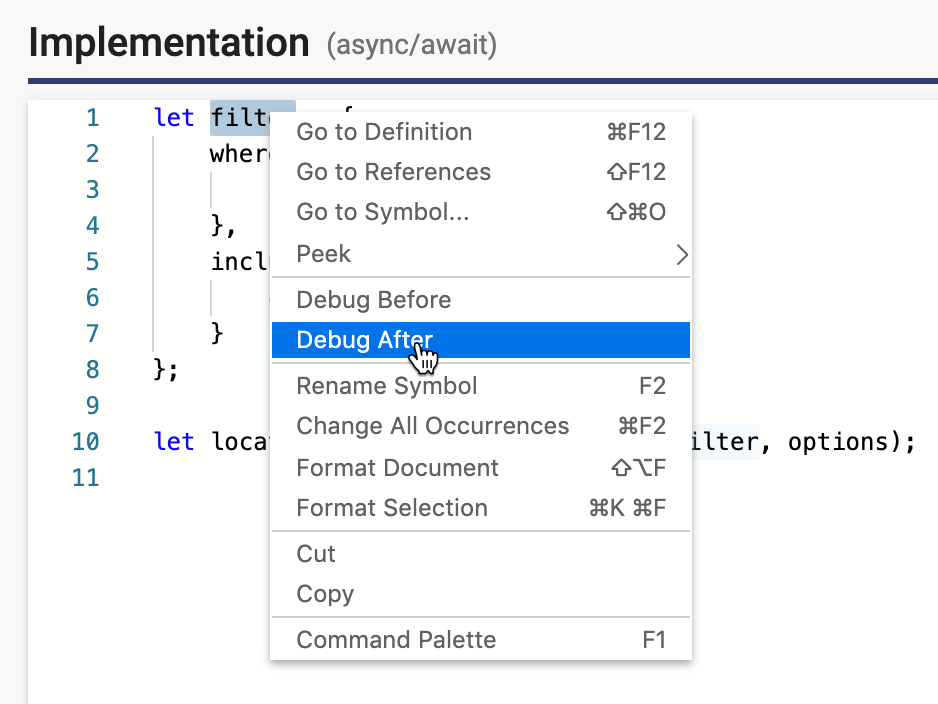
To add debug to the logic in a behavior, just select something that you want to output, right click and select "Debug Before" or "Debug After":
Apex Designer will automatically add a line after like this:
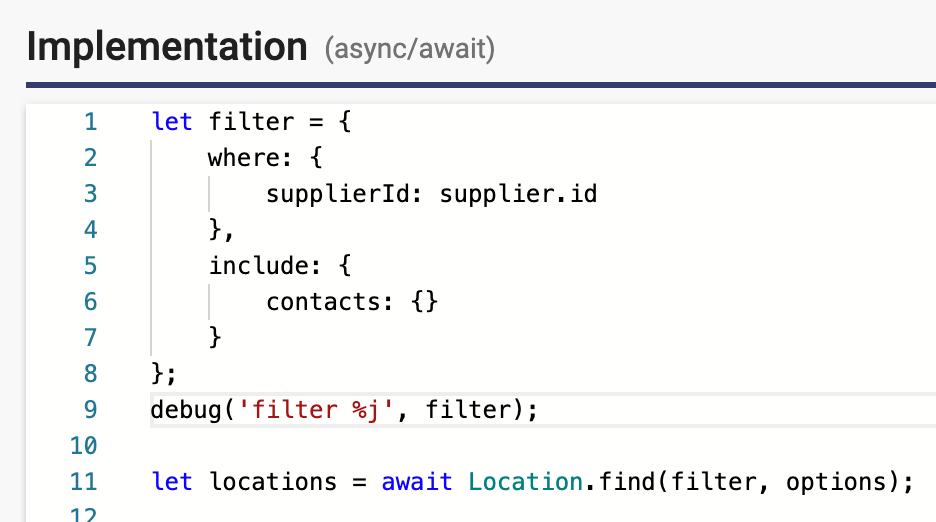
The "%j" is a Formatter that makes the output a single line of JSON which makes it more compact in the logs.
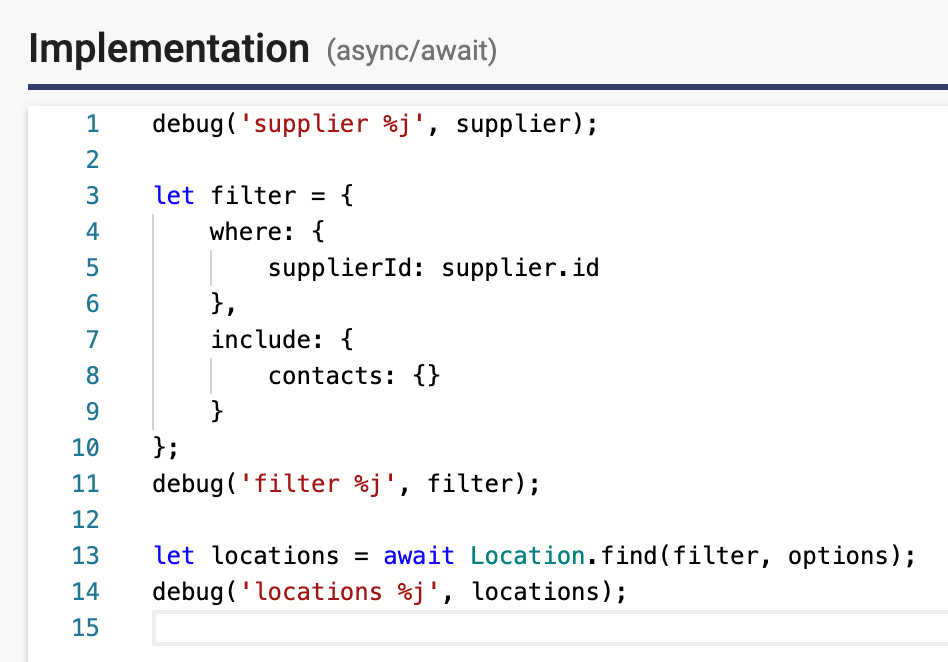
I typically add debug statements for inputs and each change to the data:
Setting the Debug String
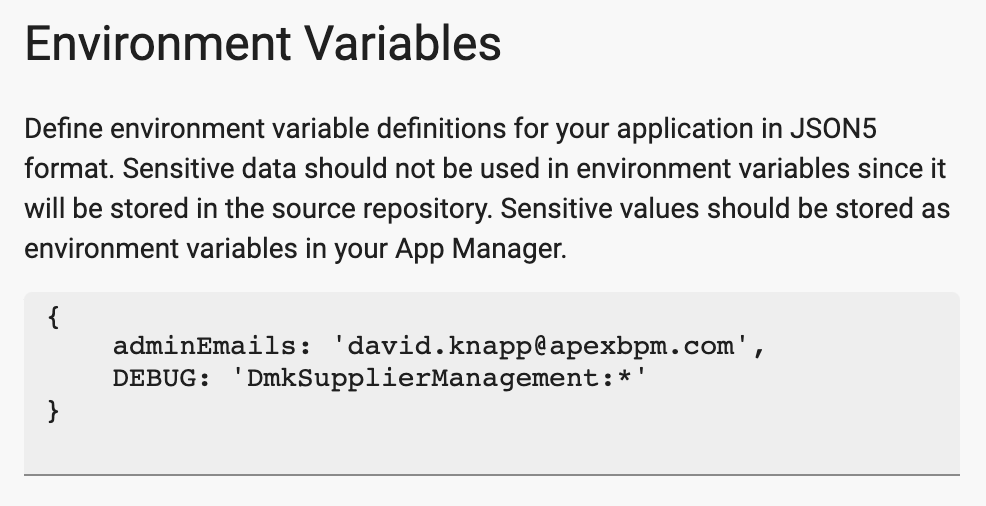
By default, all debug is turned off. You turn debug on and control what is included in the logs with the DEBUG environment variable. Since the DEBUG environment variable value is not sensitive information, you can set it on Settings + Environment Variables. To get all debug for your app, add a capital case value like this:
Debug String Patterns
The code that Apex Designer generates includes a hierarchy of debug strings:
| Level | Example | Description |
| Application | DmkSupplierManagement:* | Include all debug for the Dmk Supplier Management app |
| Business Object | DmkSupplierManagement:Supplier:* | Include all debug for the business object Supplier |
| Behavior | DmkSupplierManagement:Supplier:contacts | Include only debug for the contacts behavior on the Supplier business object |
Here are some other examples:
| Example Debug String | Description |
| DmkSupplierManagement:Supplier:*, DmkSupplierManagement:Location:* | Include all debug from for the Supplier and Location business objects |
| DmkSupplierManagement:*, -DmkSupplierManagement:Supplier:* | Include all debug except the debug for the Supplier business object |
| *:validate | Include debug for the validate behavior on any business object |
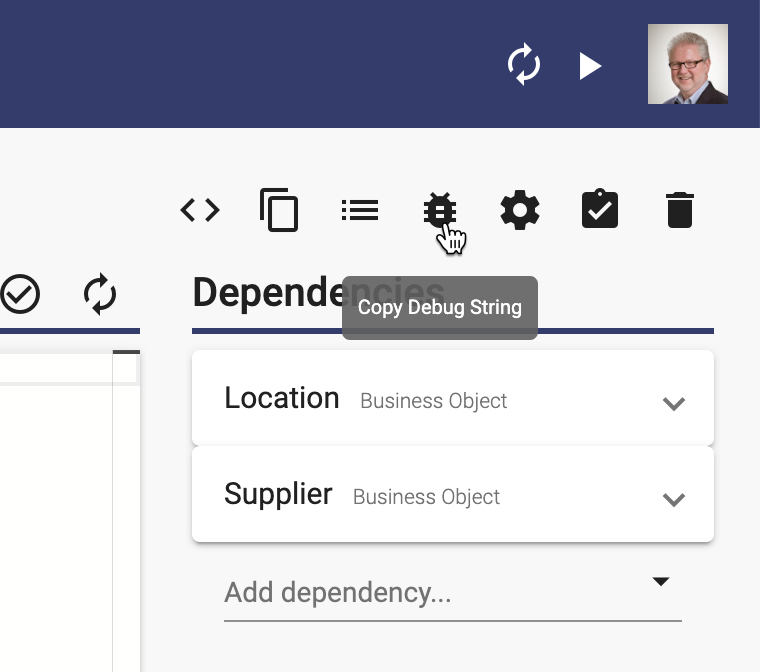
If you want to focus your debug on a single behavior during development, you can copy the debug string for that method by clicking the Copy Debug String icon button at the top right:
You might be wondering why we didn't just use "*". While this is possible, it is not recommended because the underlying Loopback framework also uses the debug module and the volume of output will be unmanageable.
Viewing Debug
To view the debug output, click on "Application Running" to open the App Manager Logs dialog and expand the "Application Running" panel:
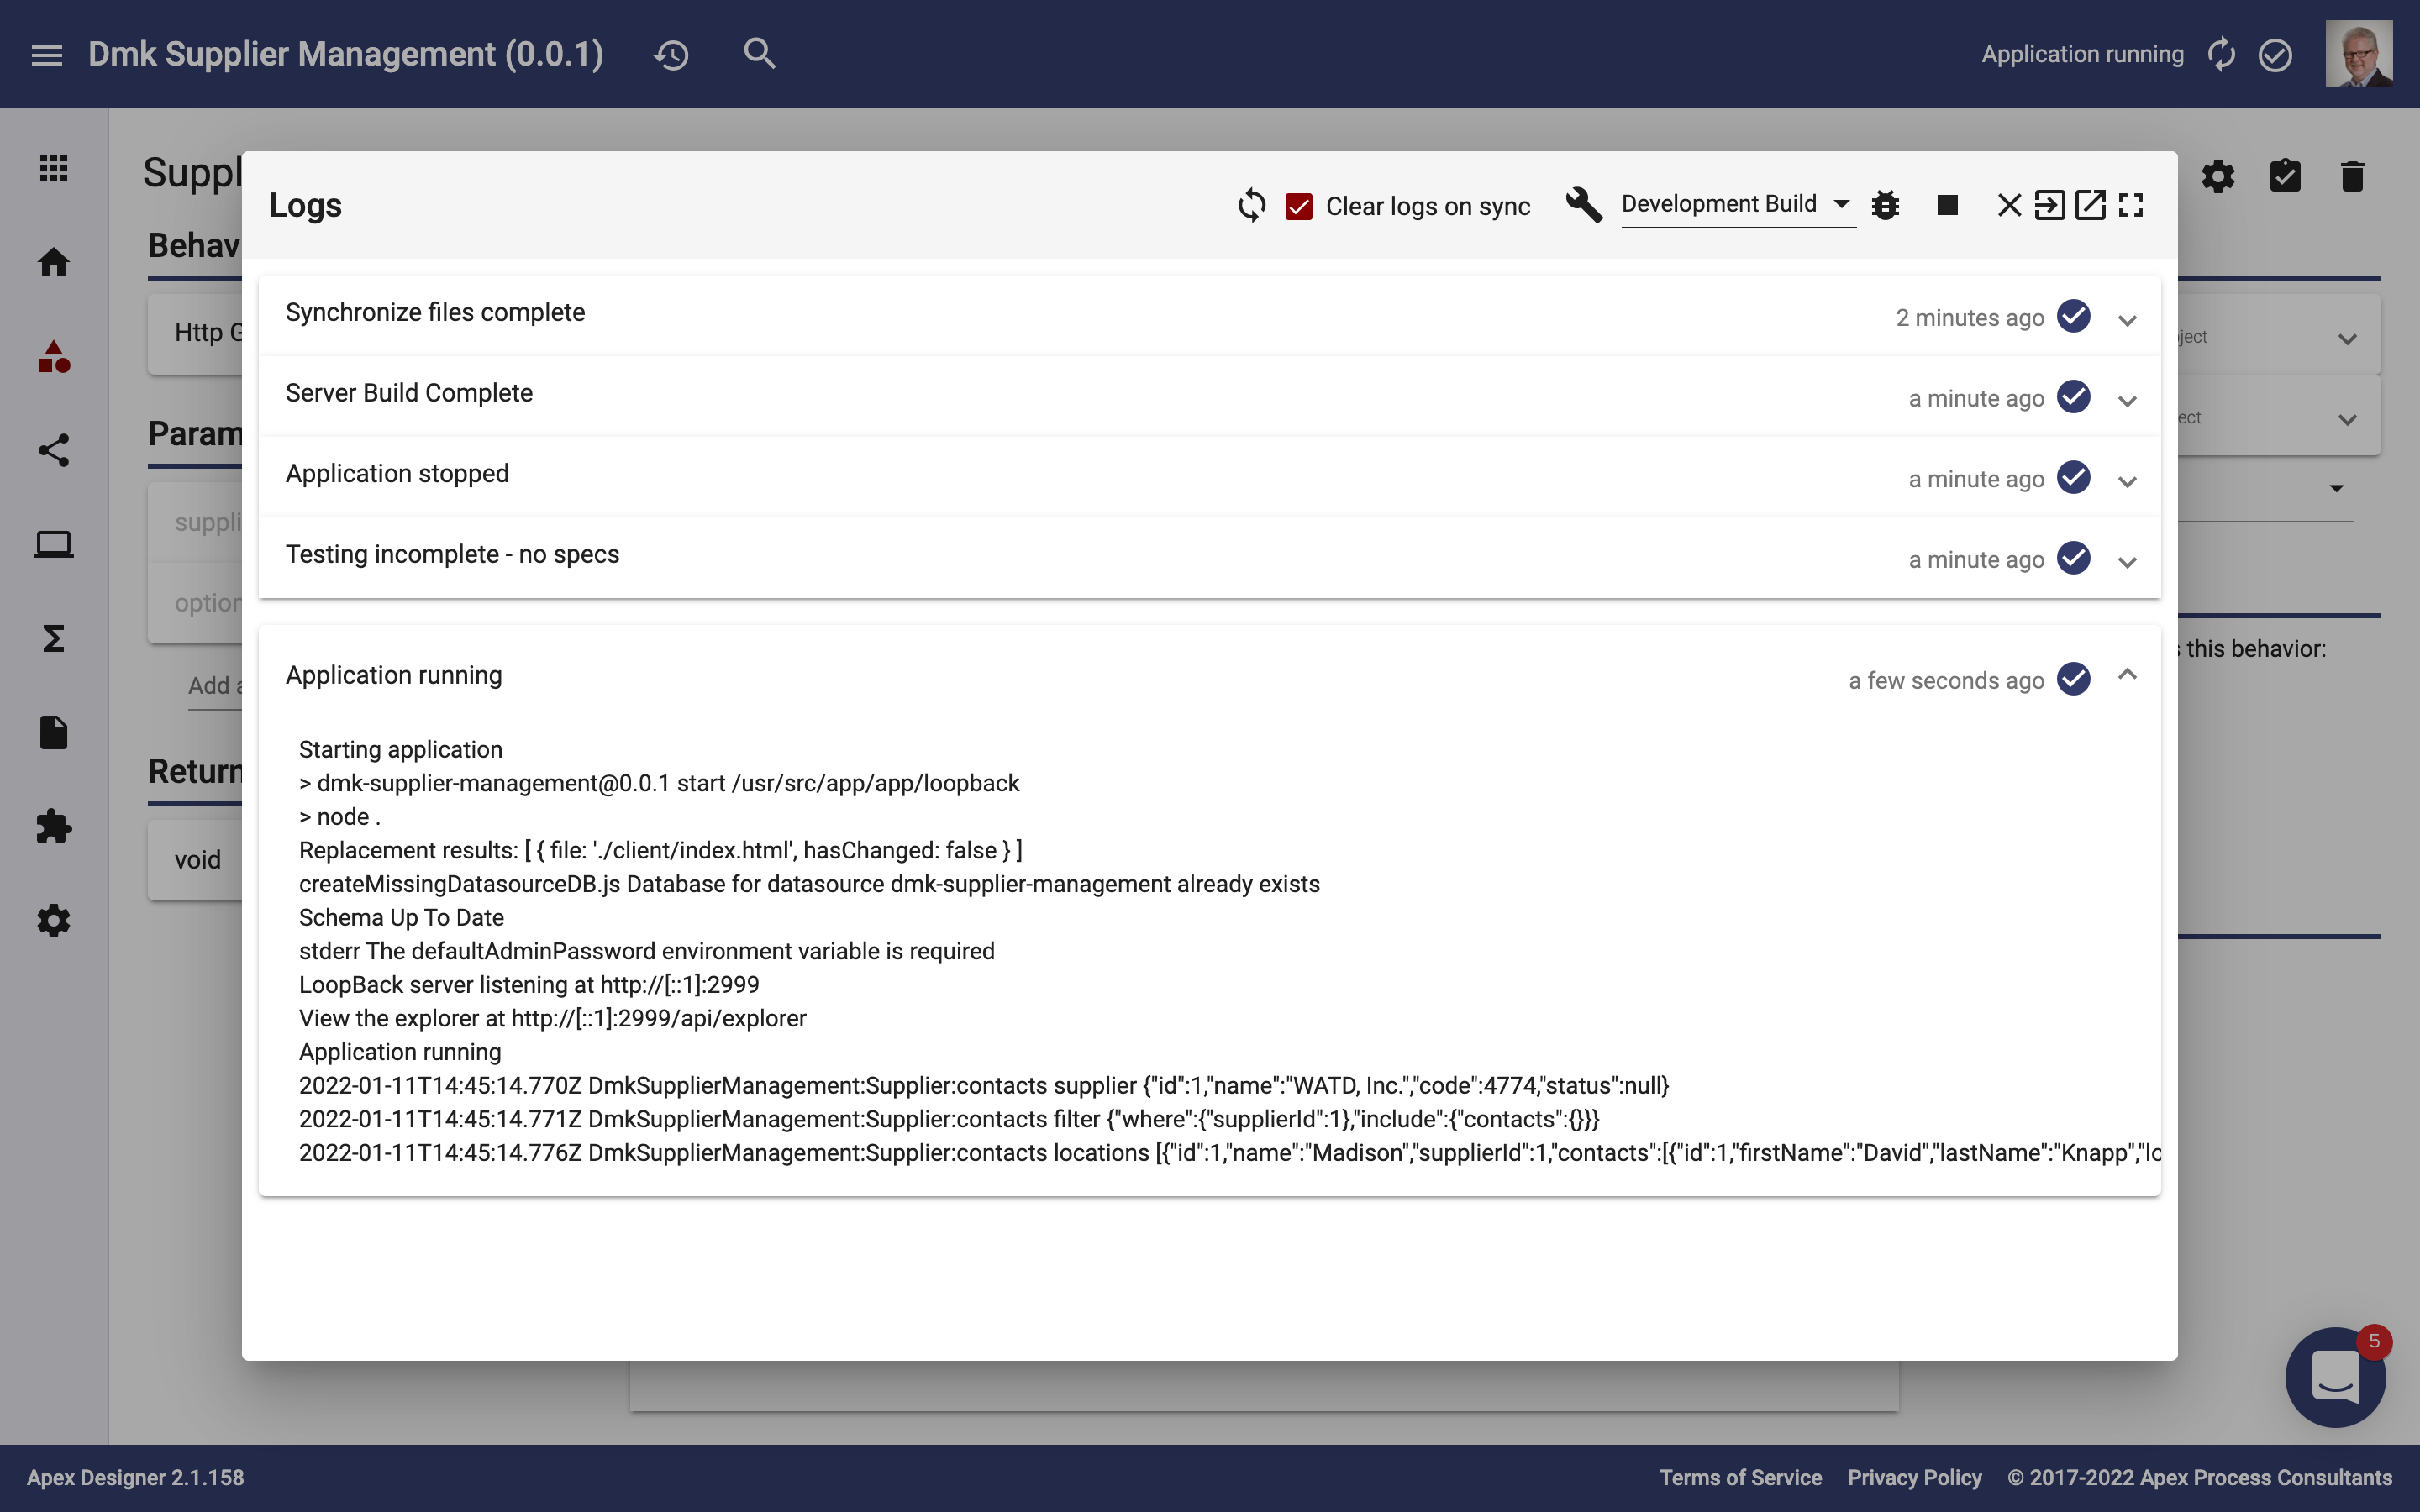
If you want to see the logs and your behavior implementation at the same time, just click Launch App Manager in a New Tab icon button and move the tab to another screen.