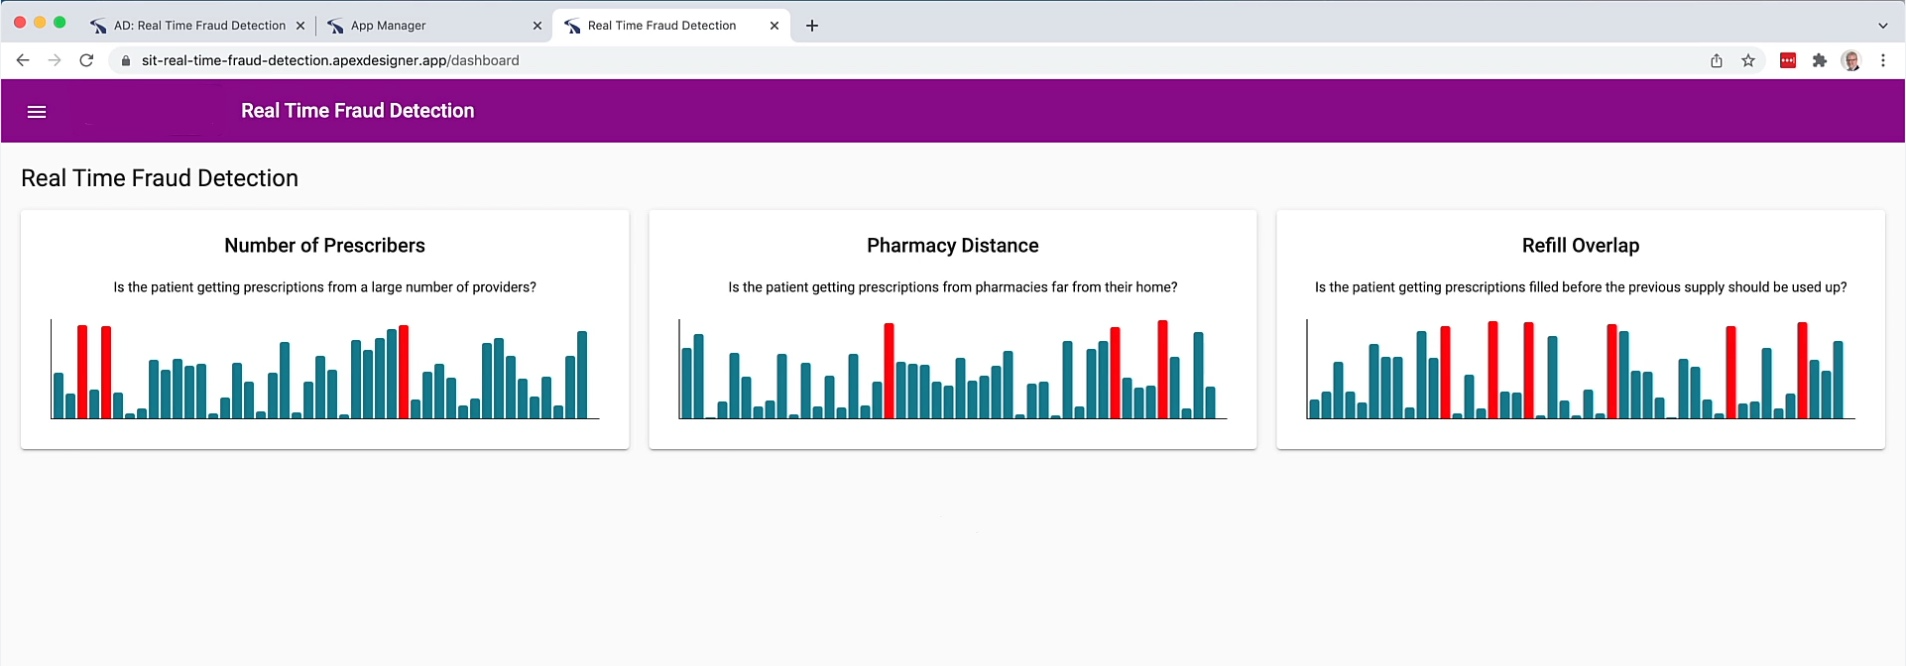
This app was built to ingest real-time FHIR data streams and apply anomaly detection rules to give a live fraud dashboard. The dashboard shows real-time charts for specific indicators on prescription fraud - e.g. distance from Pharmacy, number of providers, and refill overlap.

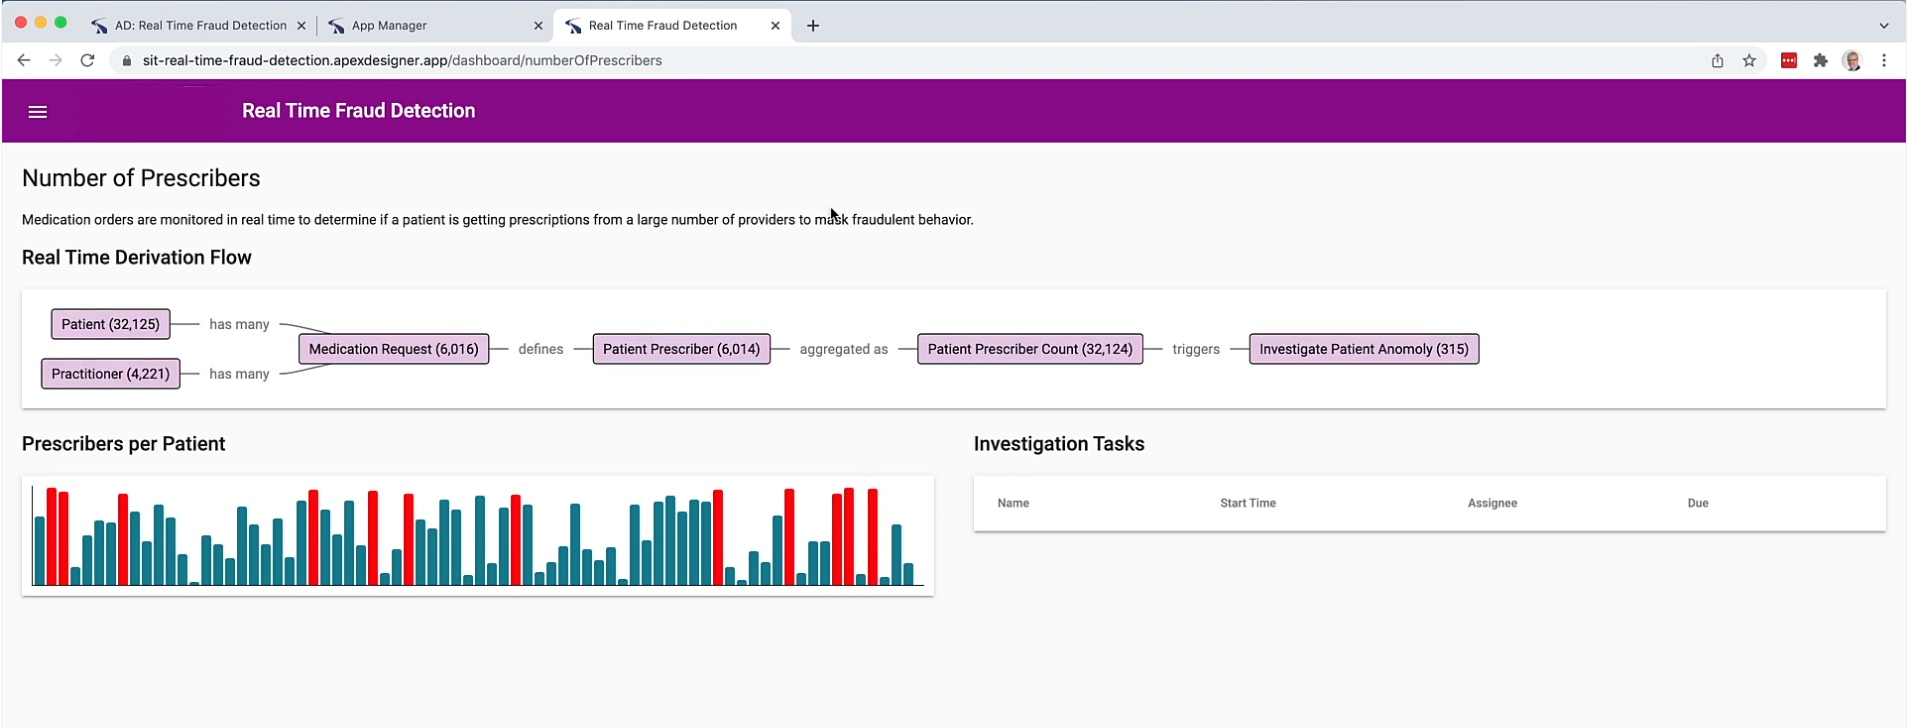
Each of the charts on the dashboard is populated by derivation logic, which can be visualized by clicking into the chart. In this case, if the count of patient-provider relationships exceeds a predefined threshold, an investigation is triggered.
