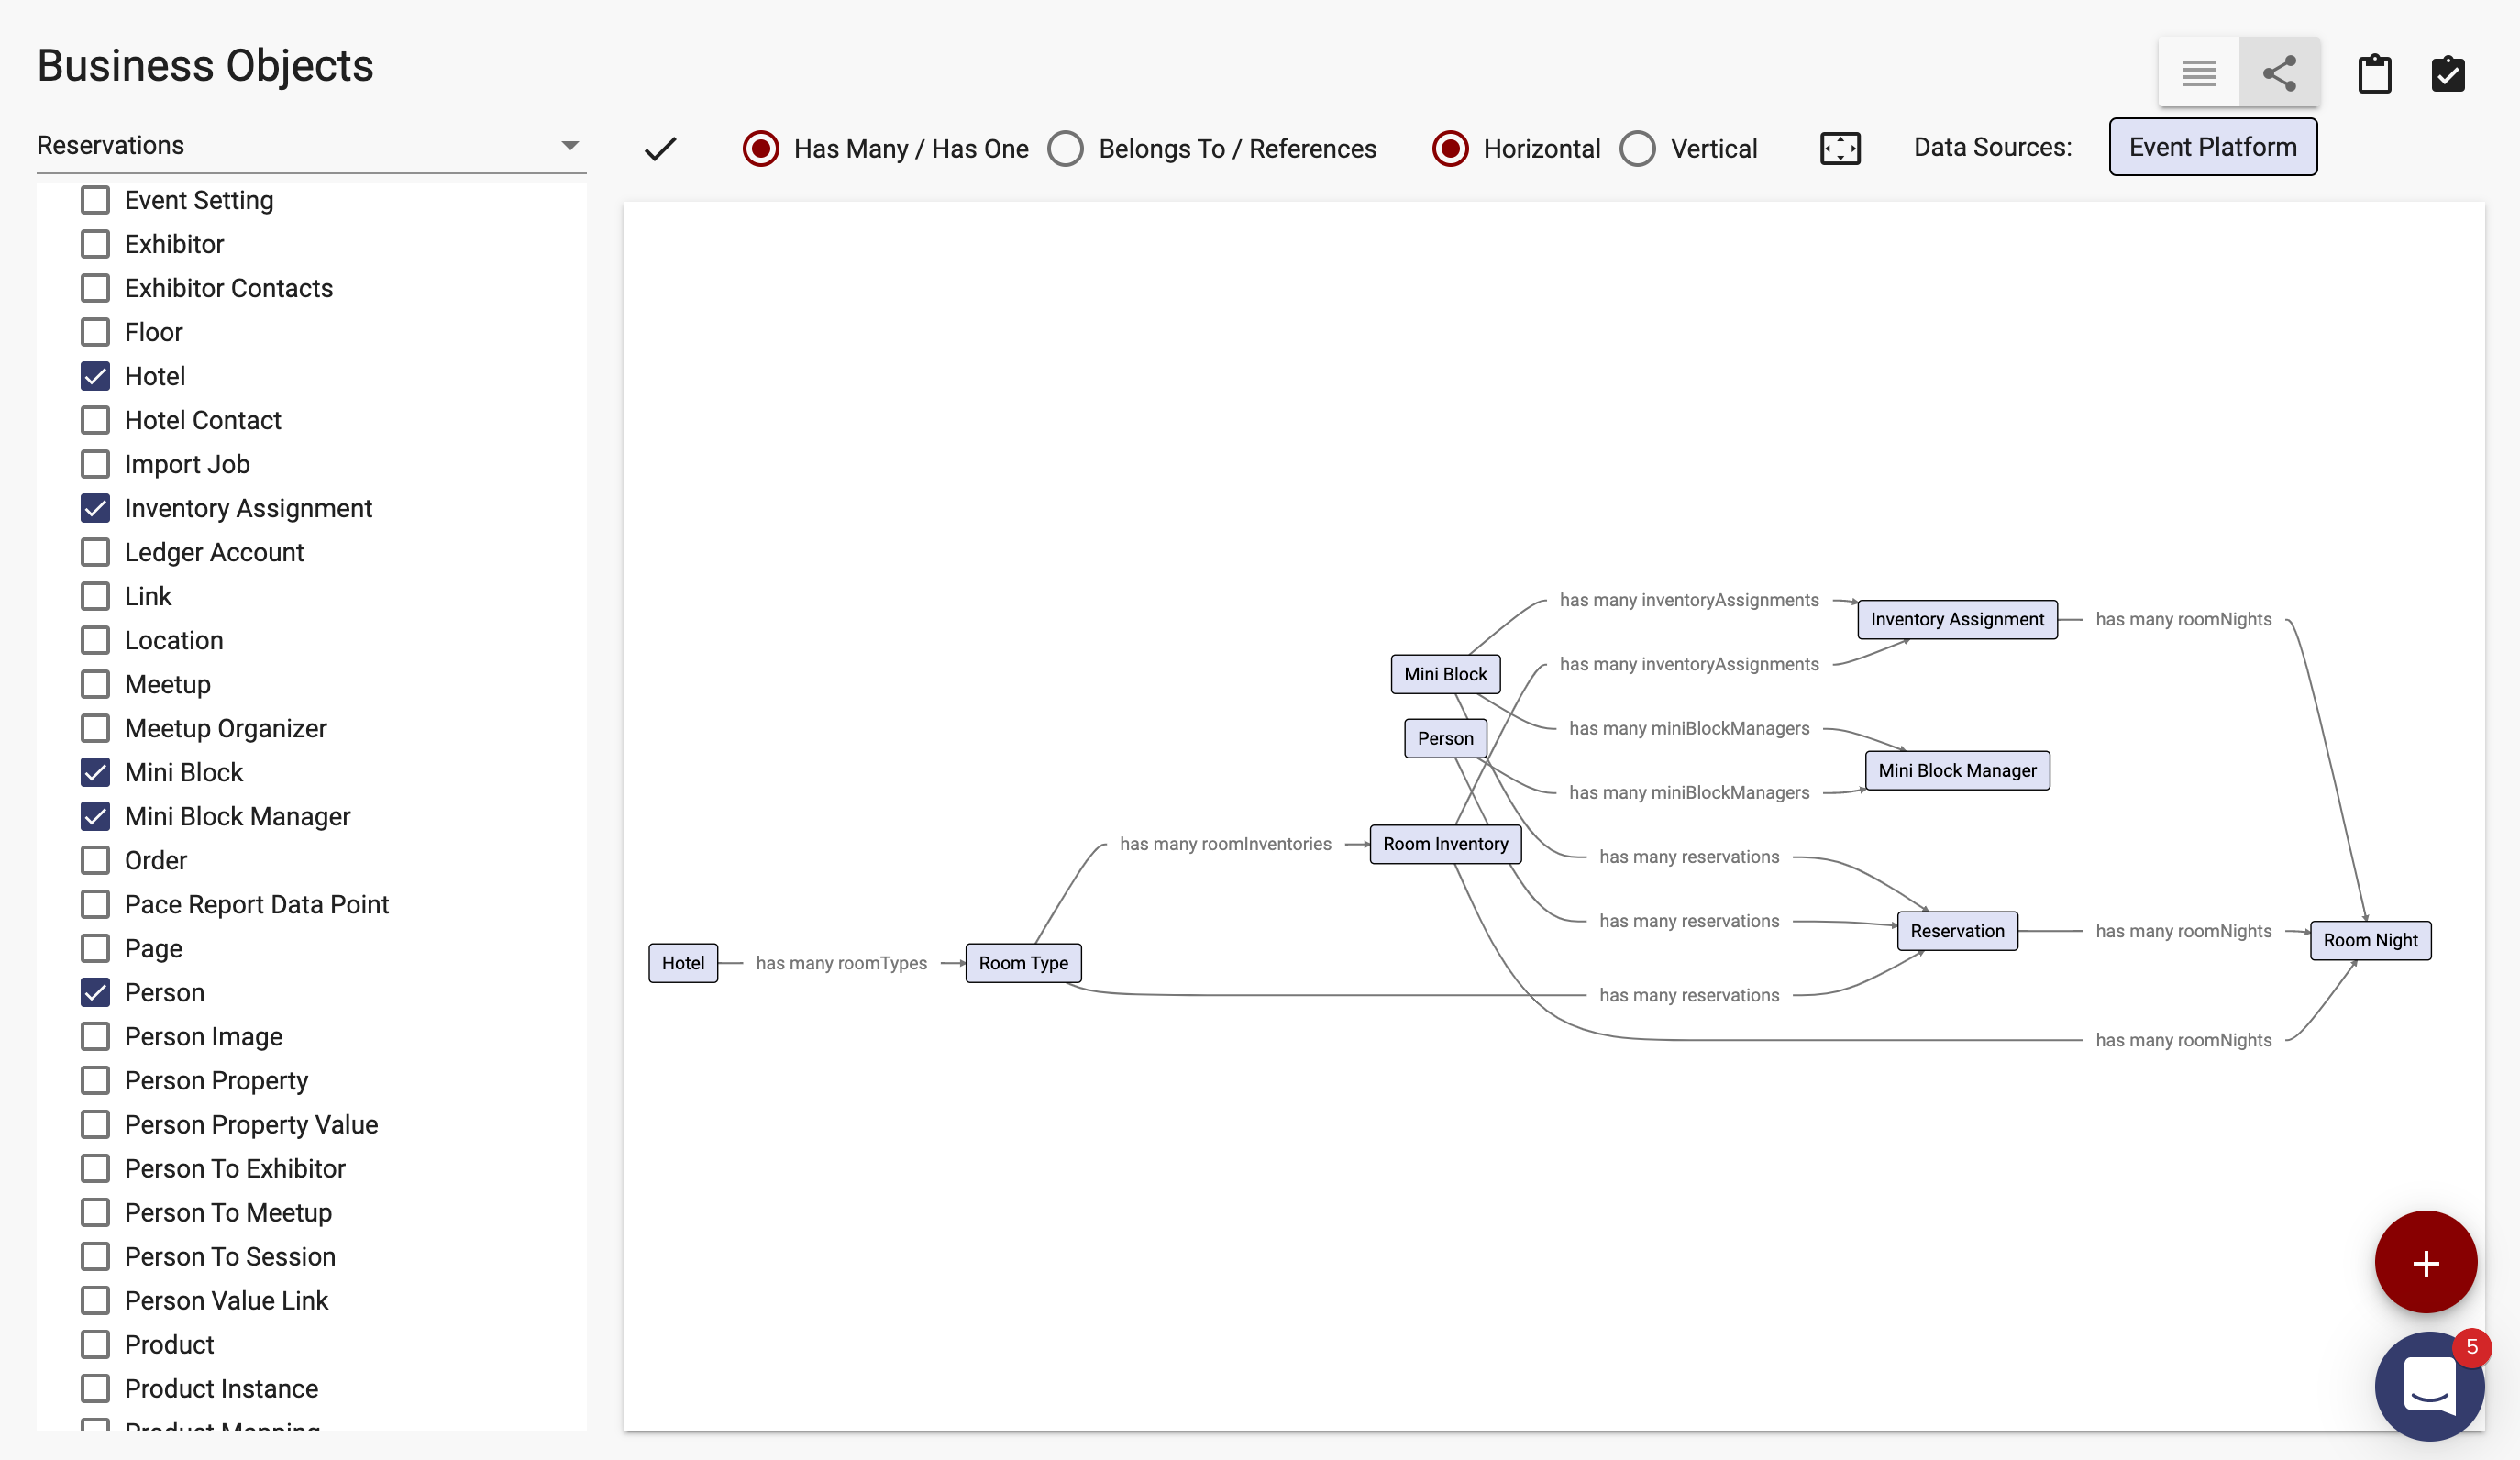
On the Business Objects page, you can click the Diagram icon button to view the relationships between your business objects in a graphical form.
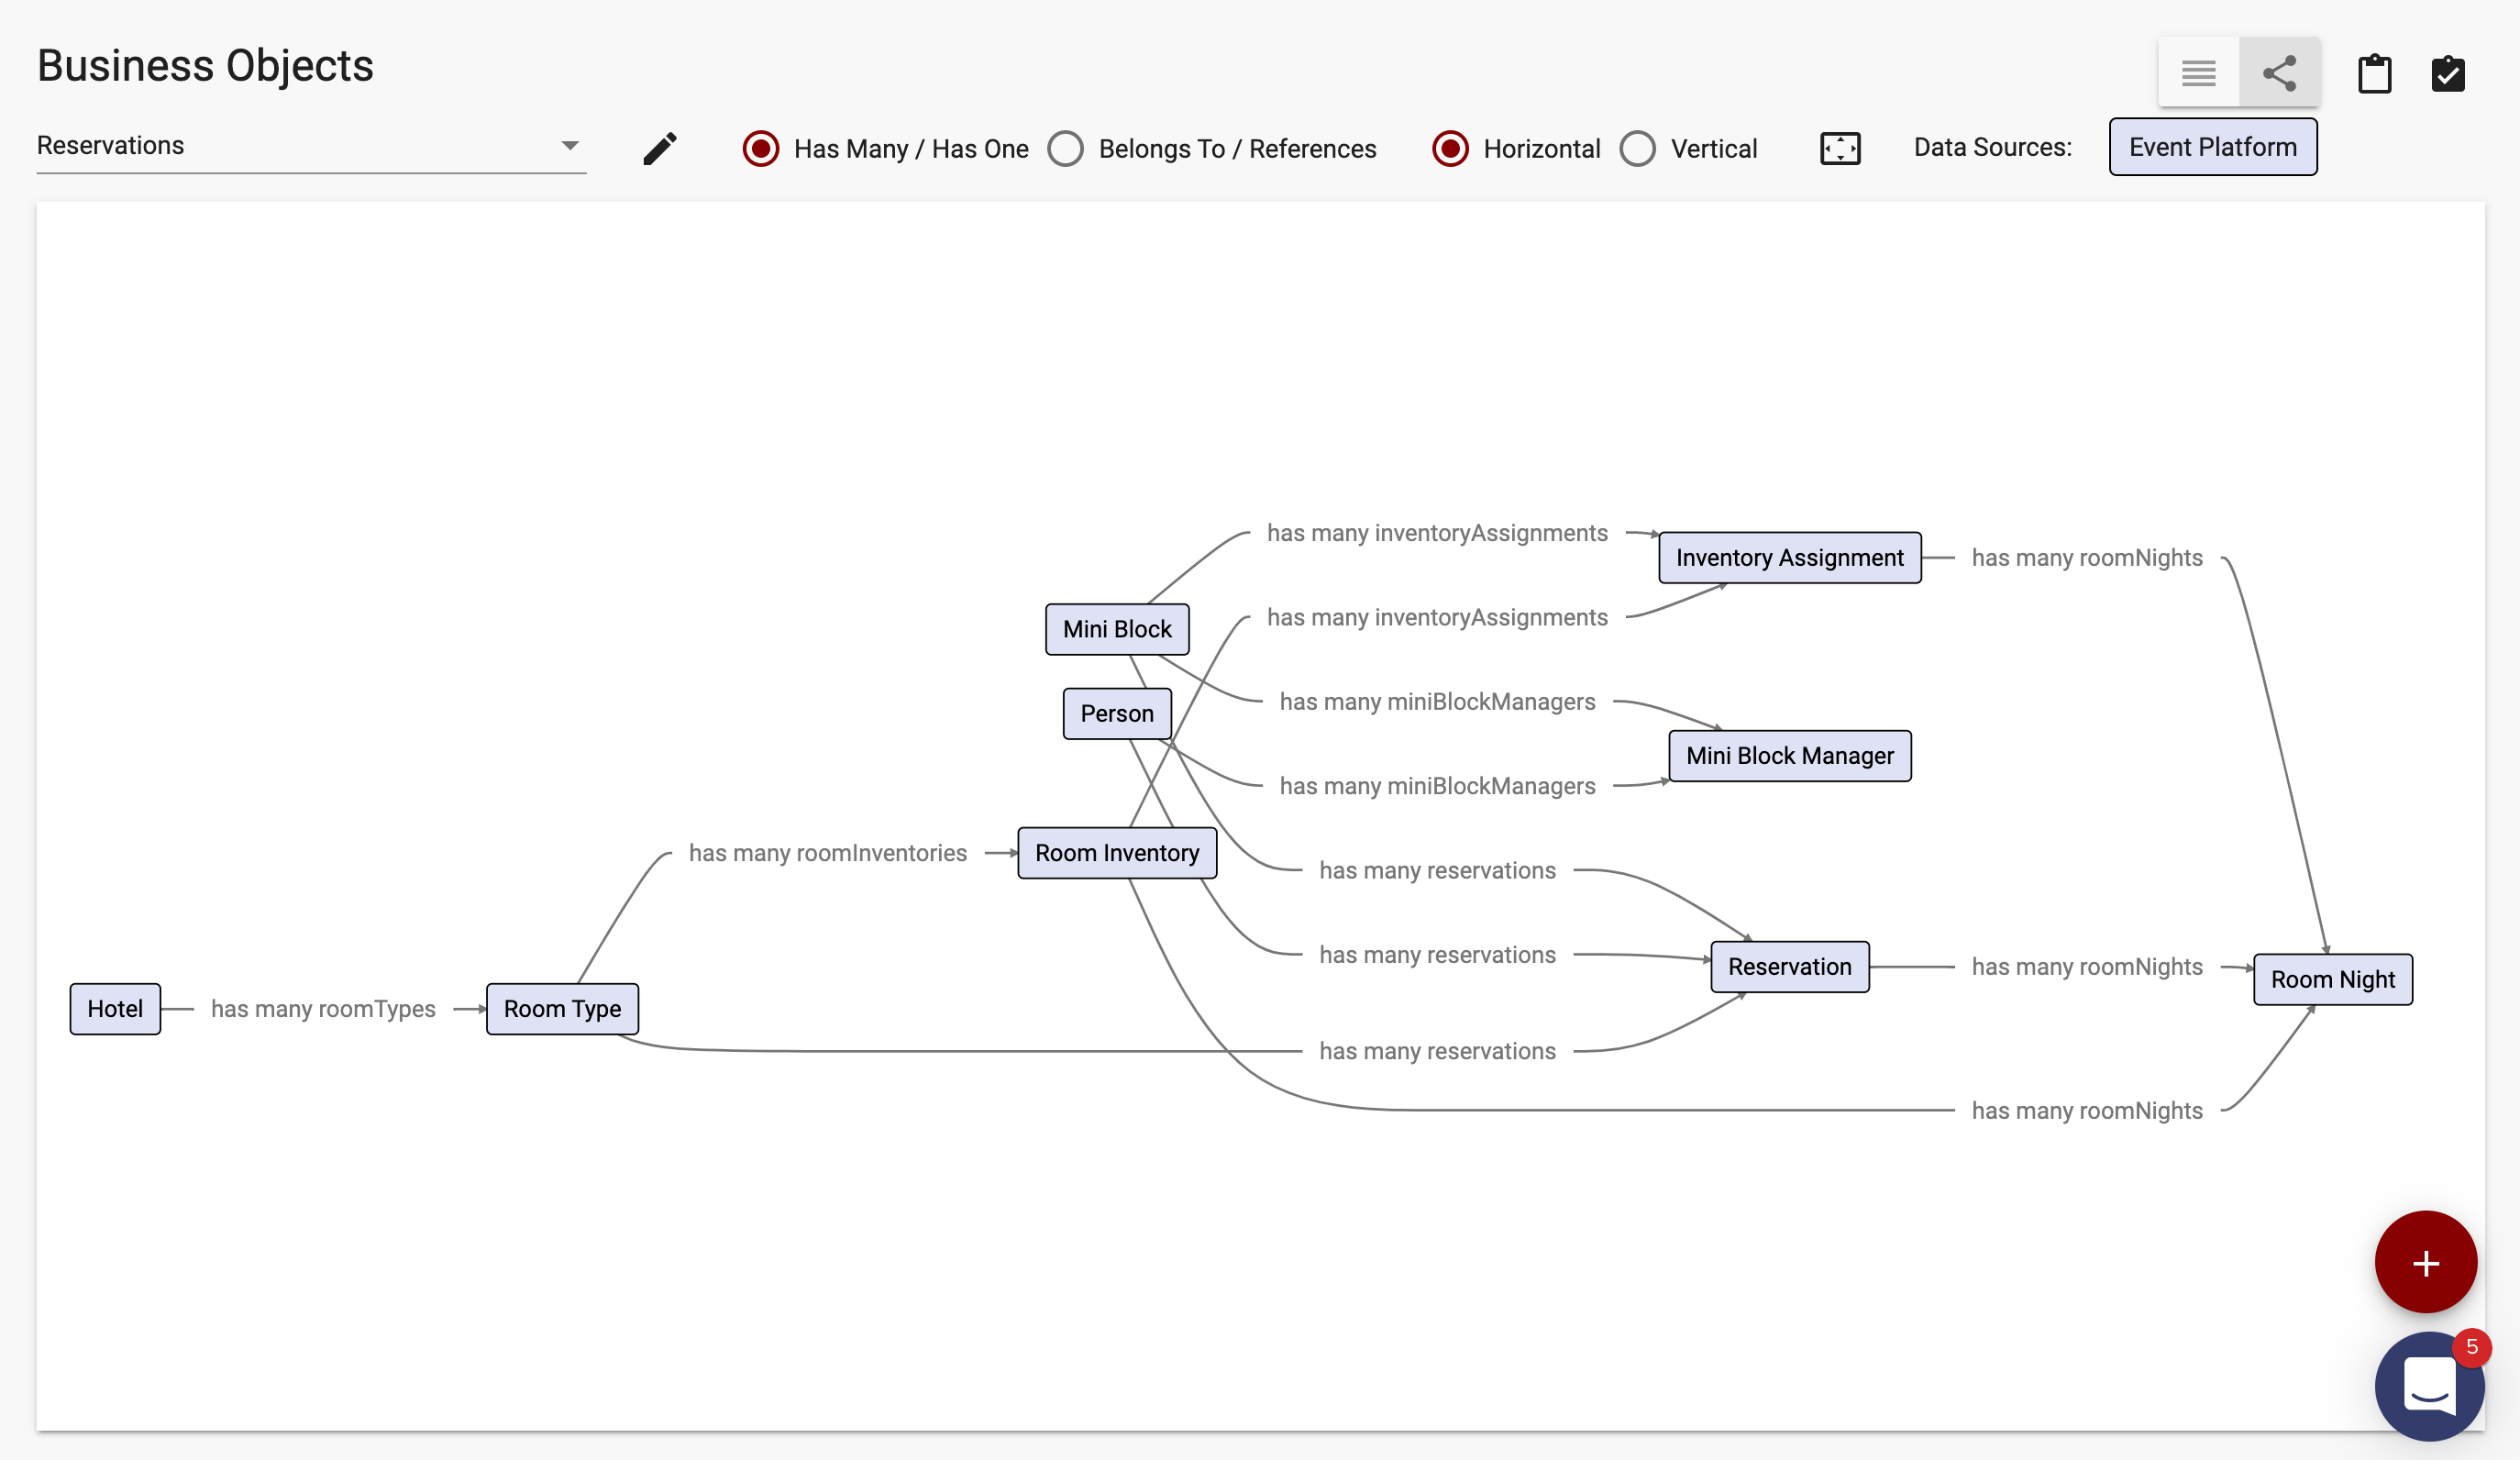
There are a set of items to control the presentation of the digram:
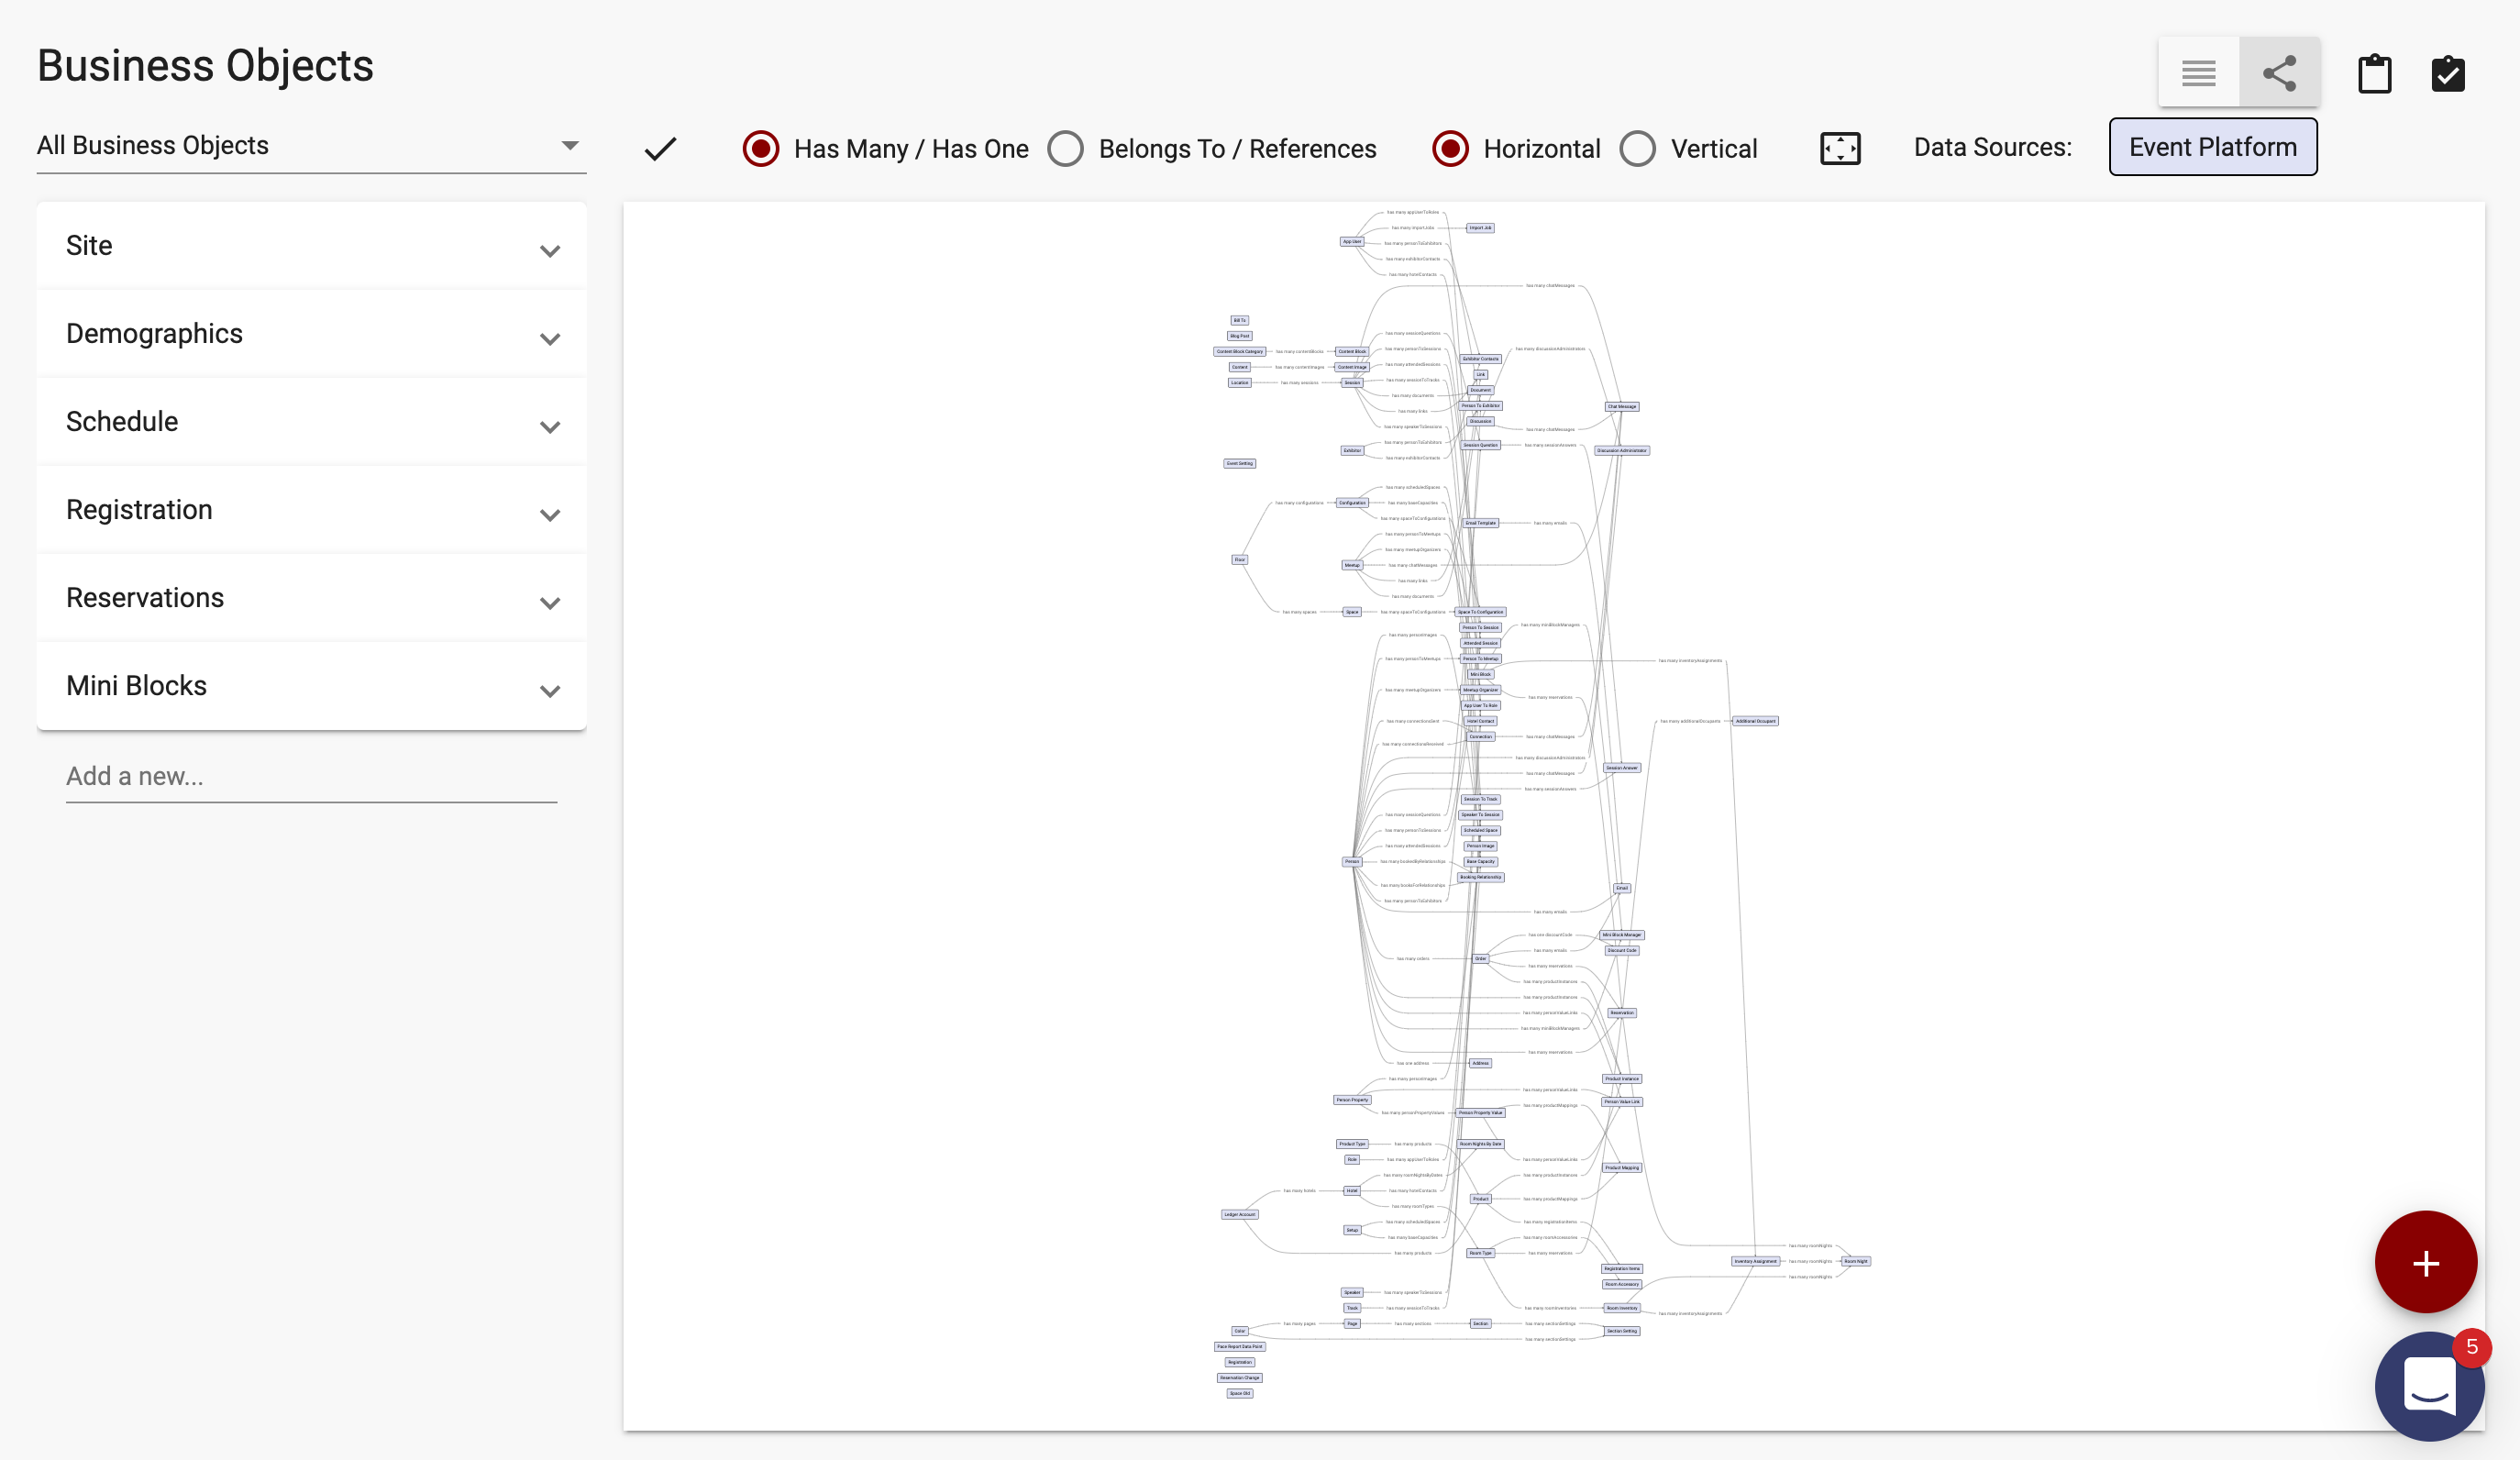
- The view dropdown selects the current view (Reservations in this example)
- The Edit Views icon button lets you create or edit the custom views
- Radio buttons to toggle the direction of the relationships (has vs belongs to)
- Radio buttons to toggle between horizontal and vertical presentation
- The Zoom All icon button zooms out to show all the business objects
Data Source Colors
If the app has multiple data sources, the boxes in the diagram will be colored based on their data source with a legend shown at the top right.
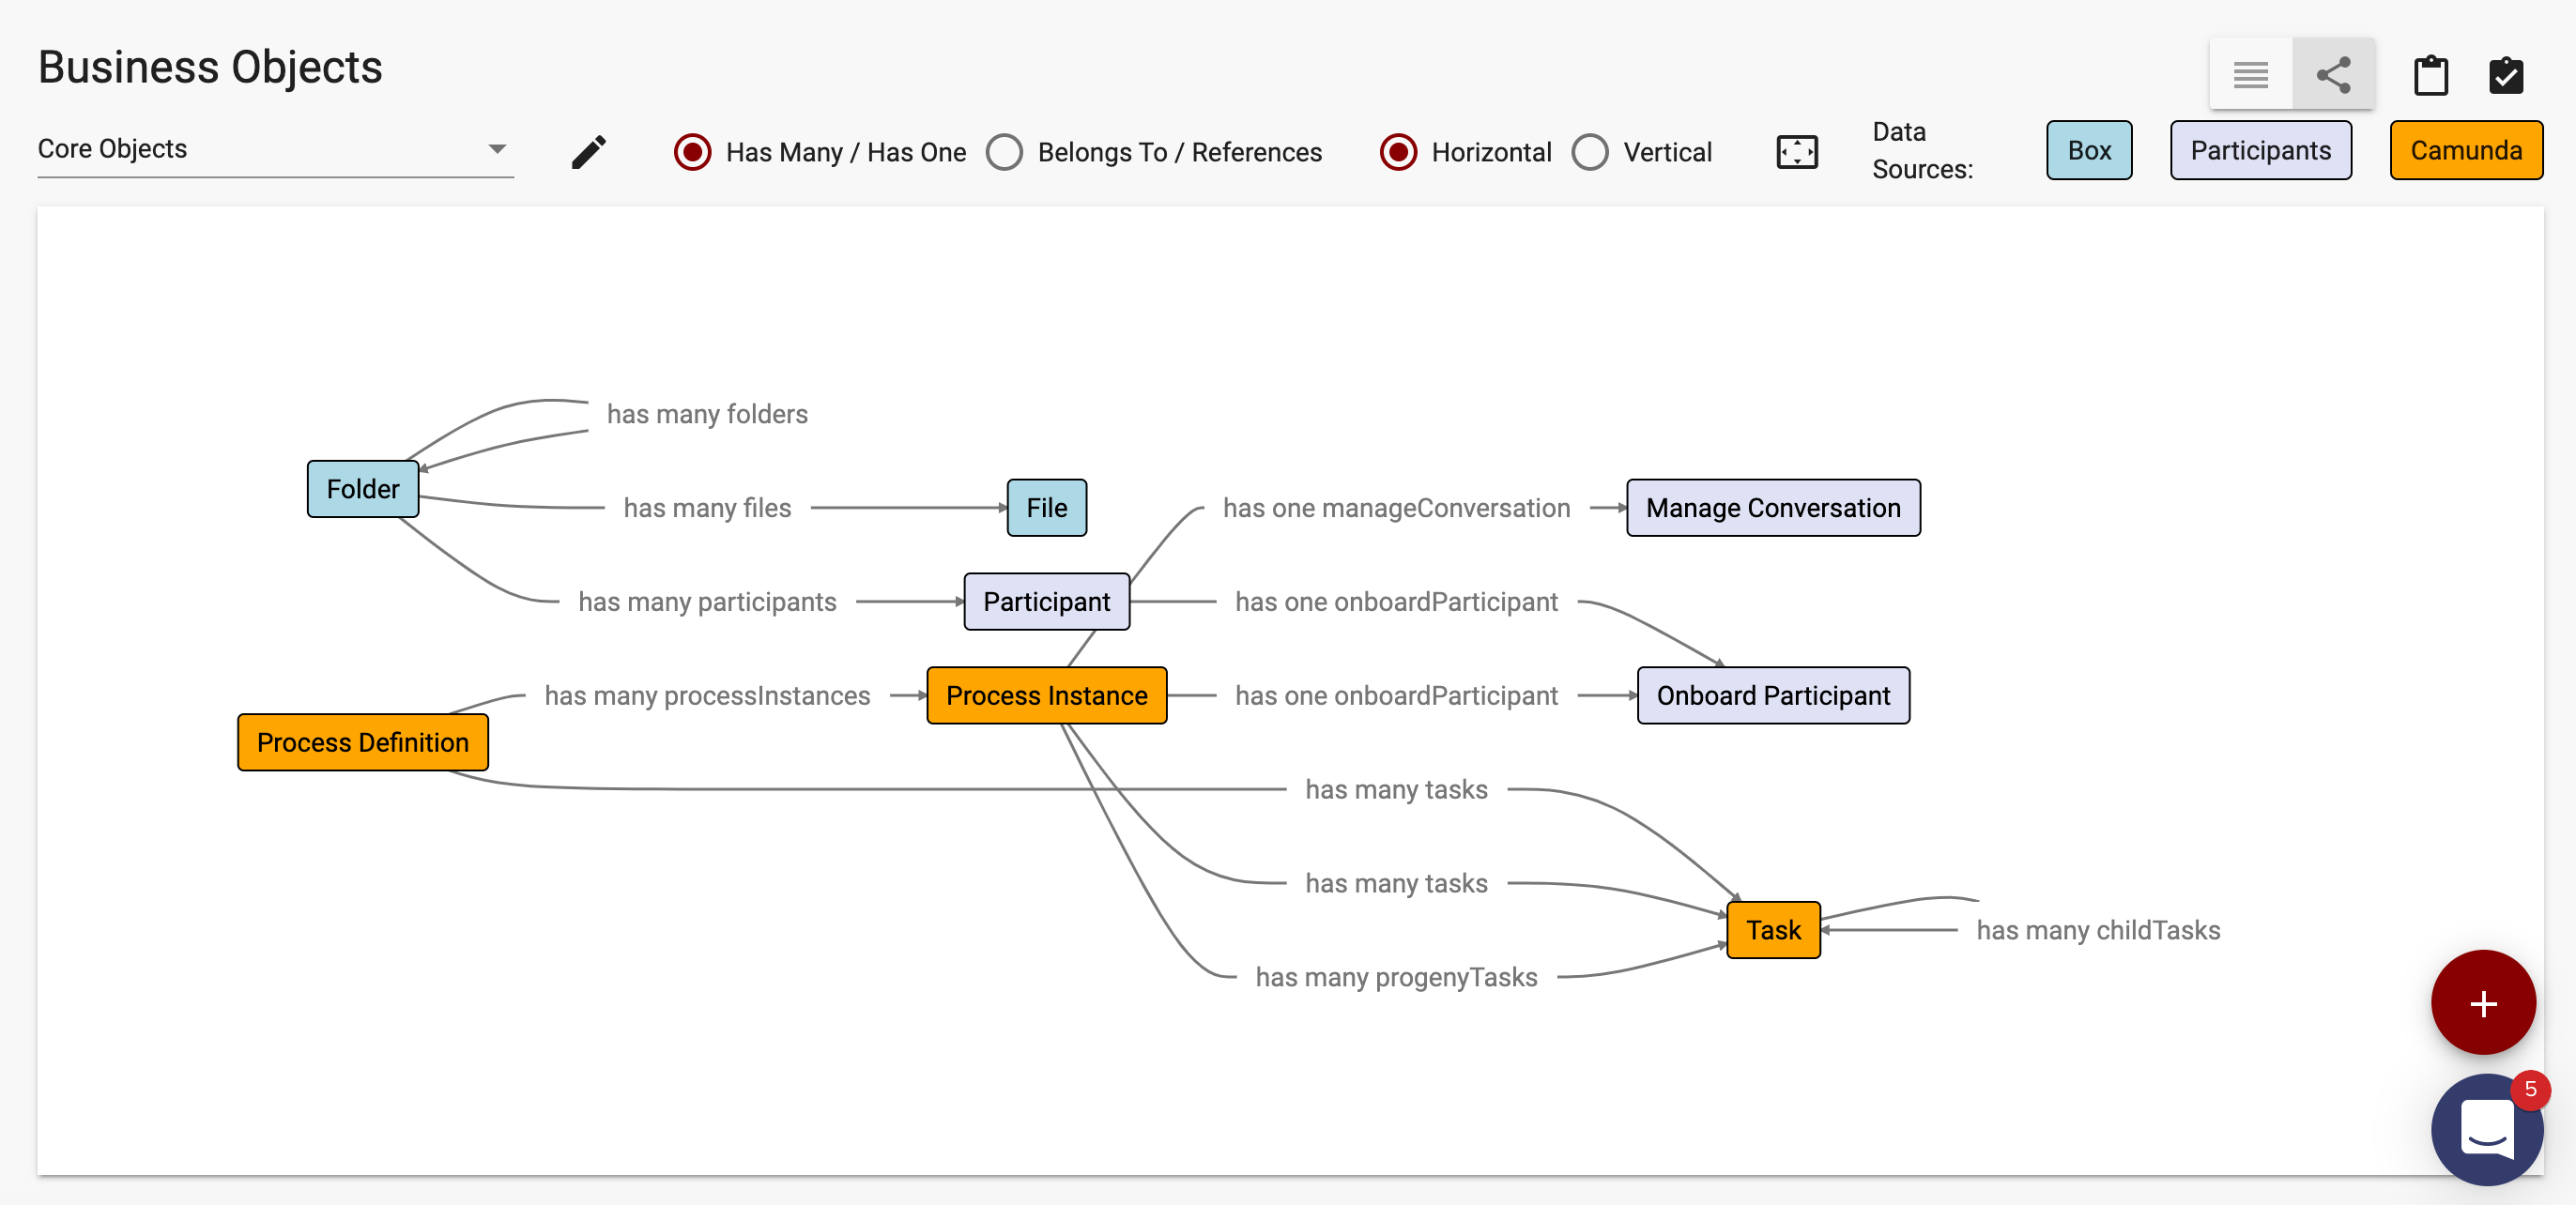
You set the color on the data source (see Data Sources for details).
Creating Custom Views
As your app grows, showing all the business objects in a single diagram can become unmanageable.
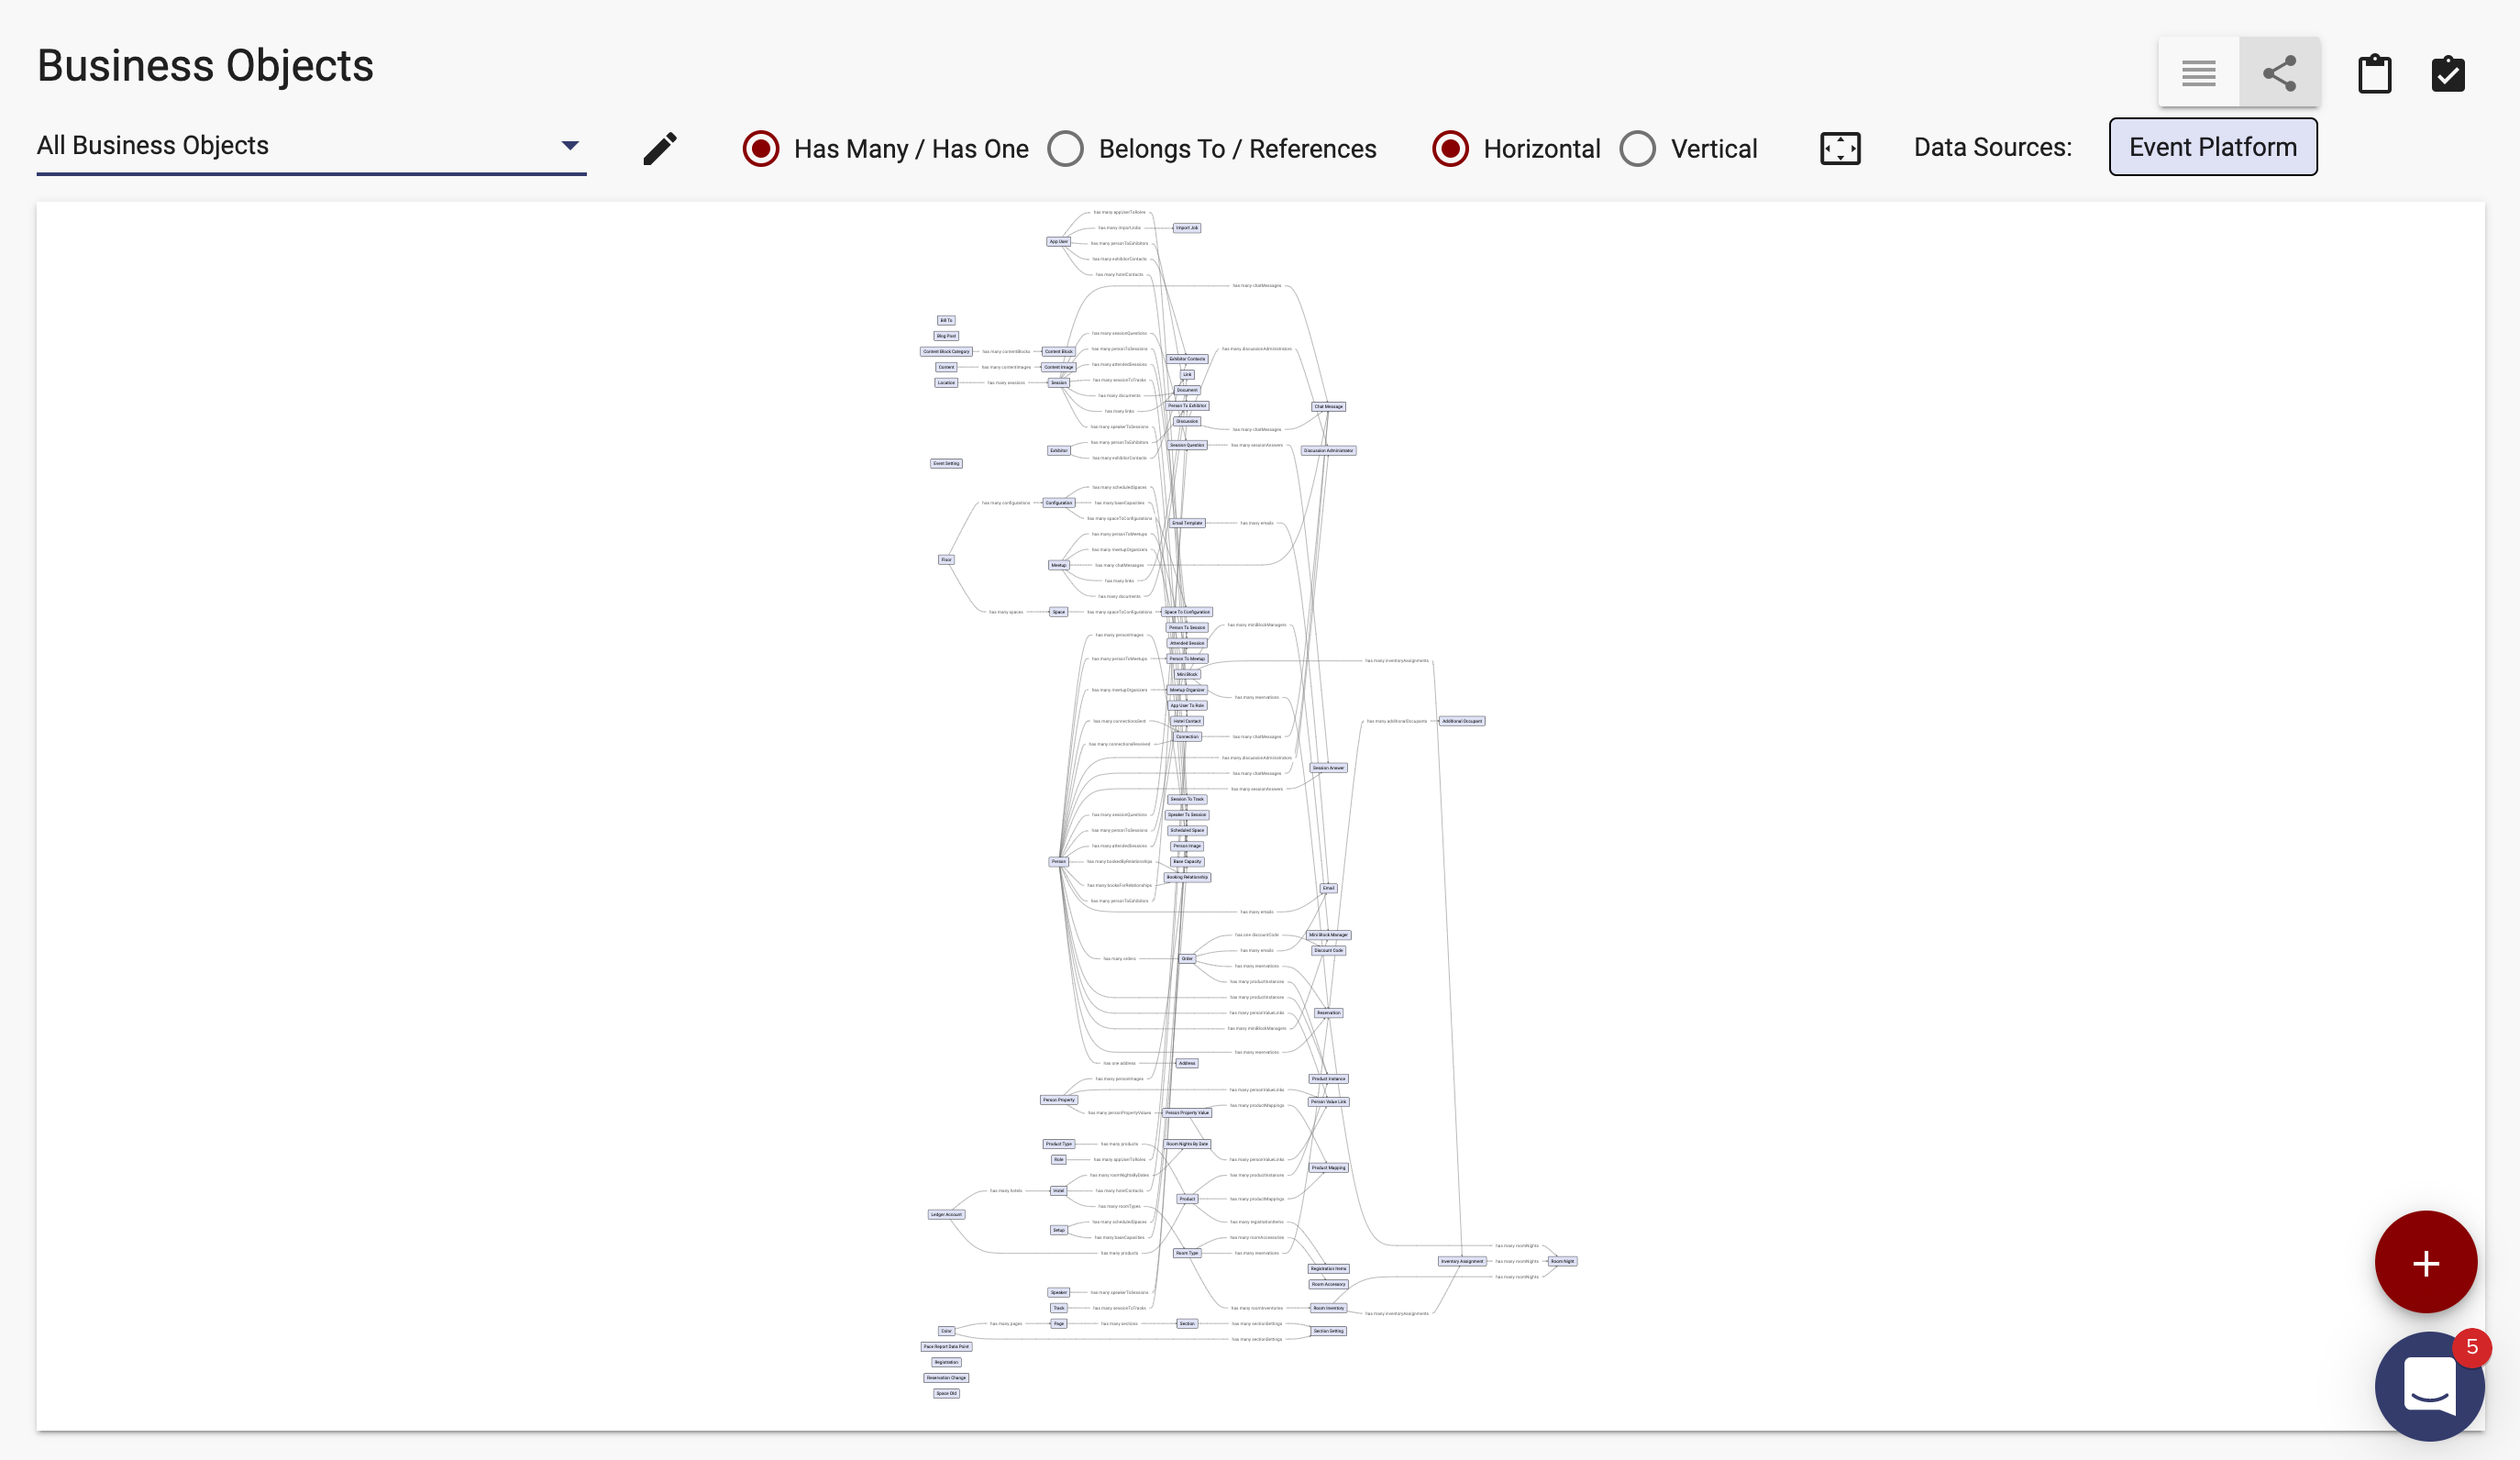
Apex Designer lets you create a set of custom views that include just the business objects related to a certain aspect of the project. You can create a custom view by clicking the icon next to the view drop down.
You can add new views or drag and drop reorder the views. Expanding a view lets you select which business objects are shown in that view.